Designer JavaScript API Classes
As part of the Designer JavaScript API, you can use the following predefined classes.
As part of the Designer JavaScript API, you can use the following predefined classes.
You can use custom JavaScript to enhance the functionality of components on a page. Any component created on the page using the Designer canvas can be modified in the Javascript tab by referencing a CSS class name specified in the Classes field of the Properties panel for the object, or using the Designer JavaScript API, to standardized classes that correspond to different component types in a page or portal. Each component class can utilize a set of predefined methods in addition to custom JavaScript.
You can apply custom cascading style sheet (CSS) properties and JavaScript code to a page, allowing you to significantly enhance the page with countless styling options and run-time behaviors.
This feature is intended for content developers with CSS and JavaScript coding experience. The CSS and JavaScript options are available to developers, administrators, and users with text editor access.
This video will show you how to enable Embedded JavaScript and CSS features in WebFOCUS Designer and use them to modify the look of a page or workbook and to add additional elements to its interface.
These features are only available to Developers, Administrators, and other users with the Text Editor privilege.
To enable the JavaScript and CSS features in WebFOCUS Designer, open the Properties panel and, under Embedded Resources, select CSS and JavaScript.
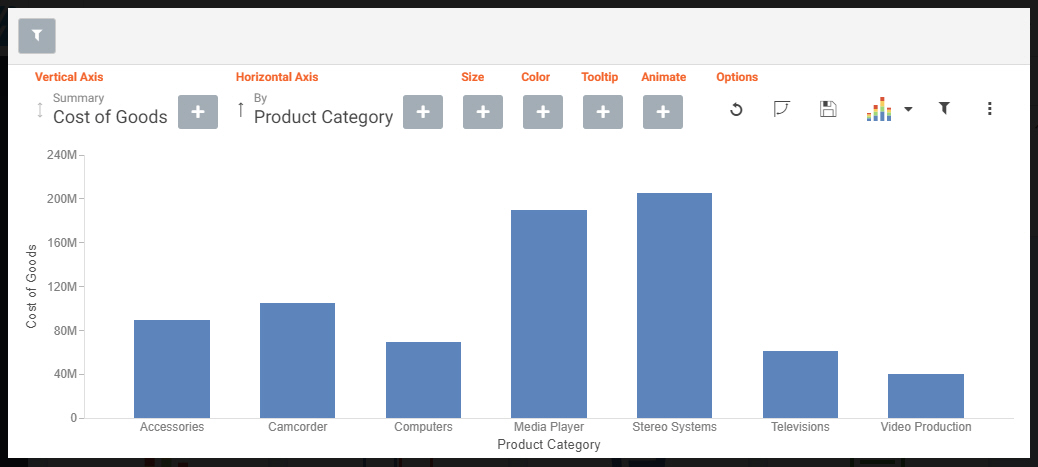
The Options toolbar is located in the upper-right corner of the Insight interface. These options control your interactions with your data, including options such as pivoting and filtering. You can also change your chart type using the Chart Picker option.
The following section describes the icons that display on the Options toolbar.
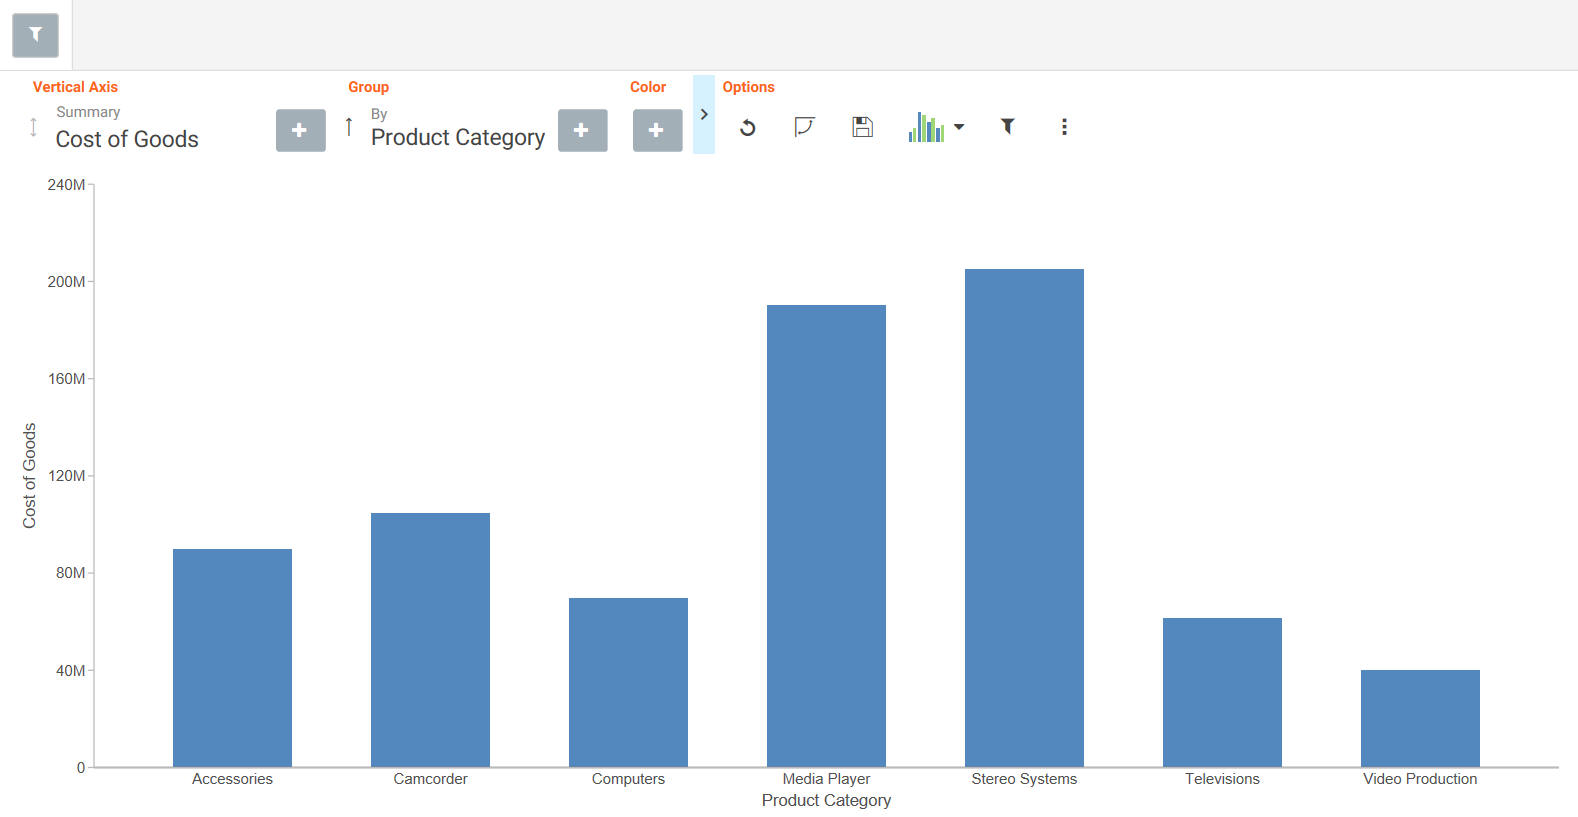
To enable filtering, click the Show Filter icon  , which is located in the Options section of the toolbar. This opens the filter shelf that renders above the bucket shelf, as shown in the following image.
To enable filtering, click the Show Filter icon , which is located in the Options section of the toolbar. This opens the filter shelf that renders above the bucket shelf, as shown in the following image.
When working with measure fields, you can change the summary operators for the field from Summary (default) to Average, Maximum, or Minimum. You can also change a Count field to Count Distinct, using a similar menu selection.
When you make a selection, the axis of the relevant measure updates in the chart, as shown in the following image.
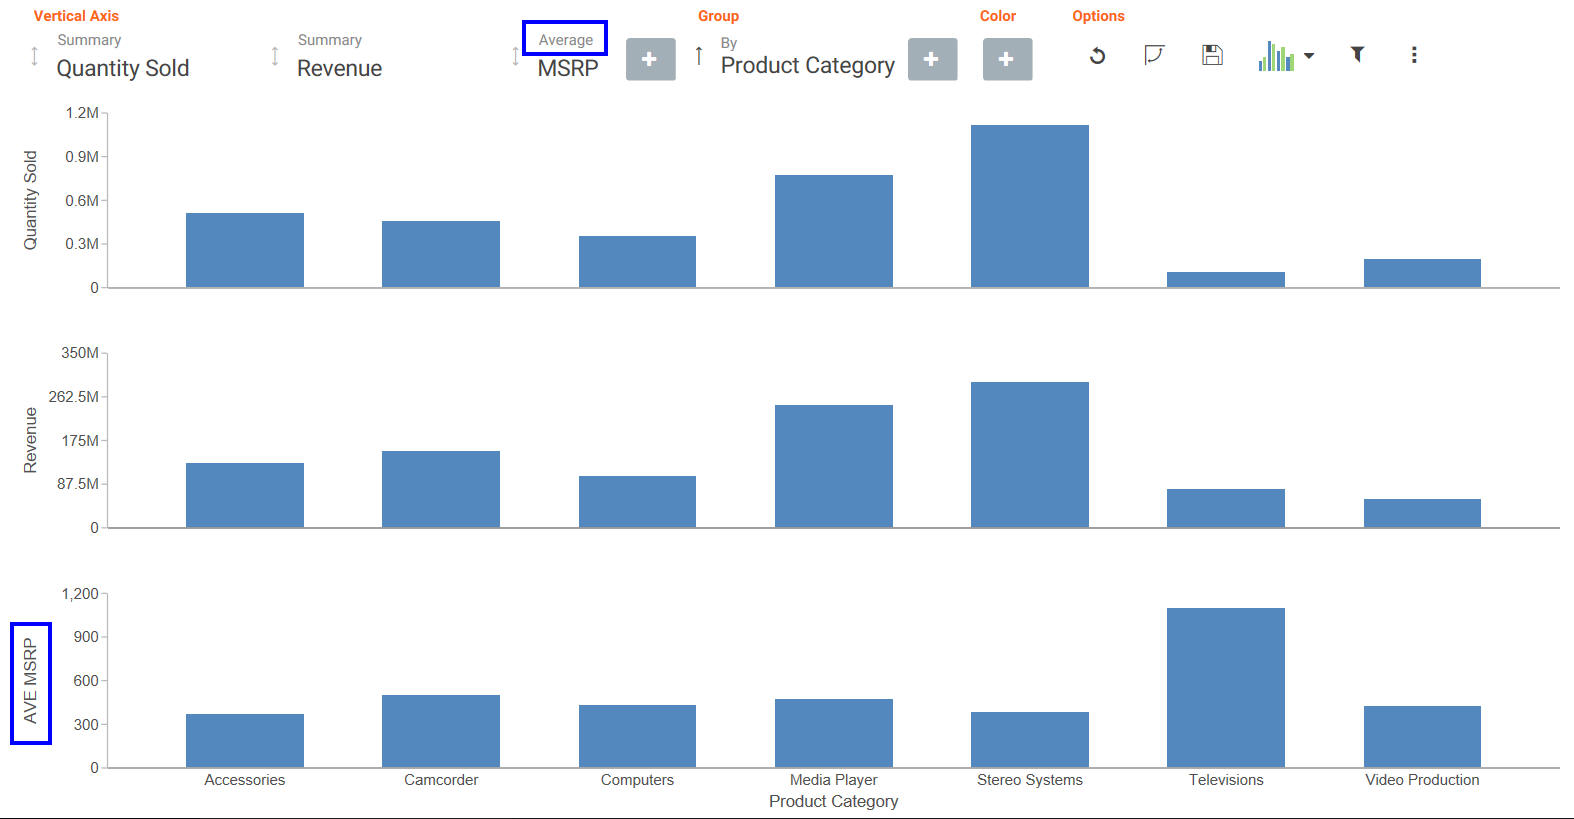
Options for changing the Summary field are shown in the following image.

With Insight, you can choose individual fields for the buckets that you add. Whether you added fields into the buckets before running Insight or left them empty, creating a chart in Insight is streamlined to allow you to easily create a dynamic chart in real time. It also provides you with the flexibility of interactive comparison as you change your data selections rapidly and adjust the options for display.
You can use the default vertical bar chart or you can specify a different chart type using the Chart Picker in the Options toolbar.