Release Features


Python Functions Distributed With the Adapter for Python

The following python statistical functions are distributed with the Adapter for Python.

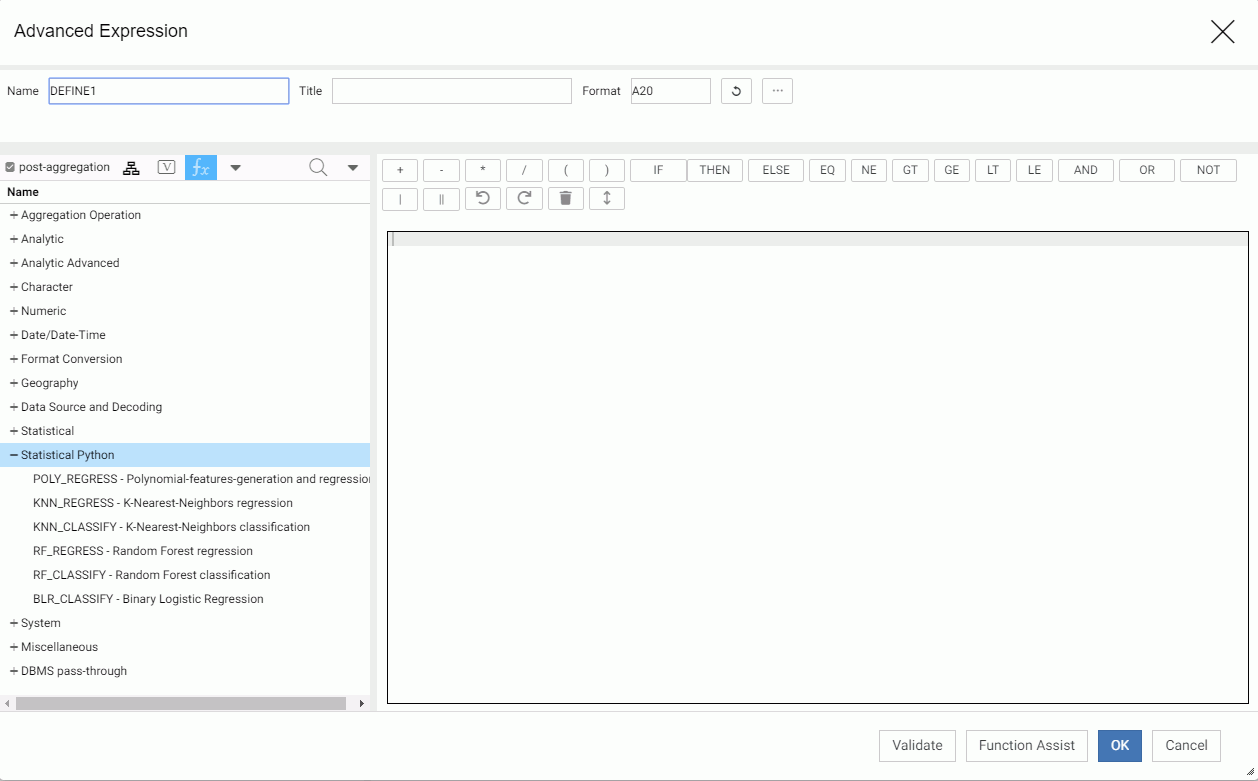
In the Reporting Server Synonym Editor, these functions are available when you create an expression. Right-click a measure field, point to New Expression, and click Apply Function or Advanced Expression. Click post-aggregation to gain access to the Python Statistical functions, as shown in the following image.

Video: Enabling Hierarchical Drilling

Auto Drill is a feature that enables anyone who views the chart to see related data by navigating field hierarchies.


You can use Auto Drill in charts using any data source with field hierarchies. Enabling Auto Drill is easy. In a chart, for example, simply create the chart using a field that is part of a hierarchy and, from the More menu, turn on AutoDrill.

Python Support

Python is a high-level, easy to use, powerful, interpreted programming language suitable for scripting, as well as complex programming.

The Python standard library, an extensive collection of modules, implements the Python "batteries included" philosophy that gives programmers immediate access to sophisticated and robust capabilities that make it easy to write your own Python functions to be used in WebFOCUS.

Using Search and Replace in the Editor

The Search button on the toolbar opens the Search and Replace pane, where you can search for and replace text in the file you are currently editing.

You can click the Search icon again to toggle the Search and Replace pane off or on. You can also close the Search and Replace pane by clicking the X in the upper-right corner of the screen.

The Search and Replace pane is shown in the following image.

The Search and Replace pane contains the following options:

Previewing Output

The Preview option on the Editor toolbar lets you run and display a preview of your report or HTML page. This option is only available for FOCEXEC files and HTML pages.

To run and preview the output of a procedure in the Editor, click the Preview button on the toolbar.

The procedure runs and the output displays, as shown in the following image.

Working With Large Data Sets

With WebFOCUS Designer, you can create content from very large data sets, which enables you to visualize and identify possible outliers or analytics that you may not see clearly in tabular report. There is no hard limit to the amount of data points that WebFOCUS can render on a chart.

Begin by connecting to your large data set or uploading it to WebFOCUS. The following image shows a large health care data set found on the web, mid-upload in WebFOCUS. It also highlights the number of rows that are available in this comma delimited (CSV) file.