Visualizing Data


Filtering a Chart with Visual Selections

You can visually create prompted filters by selecting areas of a chart directly from the canvas as you create it, as well as at run-time. This is called on-chart filtering. Since on-chart filtering is performed based on visual selections on a chart, they are quick and intuitive to create. On-chart filters created from one item immediately affect all other content created on the page, allowing you to see the impact of your filter immediately.

Adding Prompted Filters to a Visualization

As you create charts or styled tabular content in WebFOCUS Designer, you may want to narrow the display of information that is shown. You can do this by creating filters for data fields in your content. You can also use filters as a way to create custom displays of the data that you show in your content. For example, you may only want to show revenue information for specific product categories and models in a given year.

Adding Static Filters to Content

Filters allow you to limit the data that displays in your content, making it easier to find useful information by removing extraneous data values. You can create prompted filters, which allow users to select the filter values to use in your content at run time, or you can create static filters, which are always applied to your content whenever it is run. Prompted filters allow you create controls when the content that uses them is added to a page, while static filters do not. Additionally, prompted filters affect all new content on the page, or any referenced content that uses the filter.

Adding Filters to a Visualization

As you create charts and styled tabular content in WebFOCUS Designer, you may want narrow the display of information that is shown. You can do this by creating filters for fields in your data source. You can also use filters as a way to create custom displays of the data that you show in your content. For example, you may only want to show revenue information for specific product categories and models in a given year, or for product categories that exceed a certain revenue value.

Styling Reports in WebFOCUS Designer

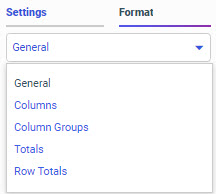
You can apply styling changes to a report to help it visually match the styling of your other content, and make it easier to read and more visually appealing. You can style a report from the Format tab on the Properties panel.

On the Format tab, you can use the quick access menu to select the section or component of the report whose styling properties you want to change, as shown in the following image.


Quick access menu for reports

Using Sort Limits

You can use sort limits to control how many values to display in a your content. While a filter allows you to limit your content by specifying which values should display, a sort limit allows you to limit it by specifying how many values should display, depending on the amount of information that you want to see.

Using Hidden Fields in Reports

When creating a report in WebFOCUS Designer, you can hide a field so that it exists in the report but is not shown as a column. The main advantage of doing this is that hidden fields are still used for sorting, which gives you more control over how the values in a report are displayed and organized. To hide a field in your report, right-click a field and click Hide. The hidden field appears slightly faded in its bucket, as shown in the following image.

Using Subtotals on Sort Columns in a Report

Page and row breaks are not available for fields in the Column Groups bucket, but you can use the subtotal and recompute options on columnar sort fields similarly to row sort fields. To add columnar subtotal columns, right-click a field in the Column Groups bucket, point to Insert breaks, and click Aggregate rows. To add columnar recompute columns, right-click a field in the Column Groups bucket, point to Insert breaks, and click Recalculate totals.

Using Breaks and Subtotals on Rows in a Report

The Subtotal options allow you to add a subtotal or recompute row after each value in the selected field. Subtotals and recomputes do not add page breaks to a report.

To add a subtotal, right-click a field in the Rows bucket, point to Insert breaks, and click Aggregate columns. A subtotal row is added for each value in the selected field and evaluated for each measure field in the report.