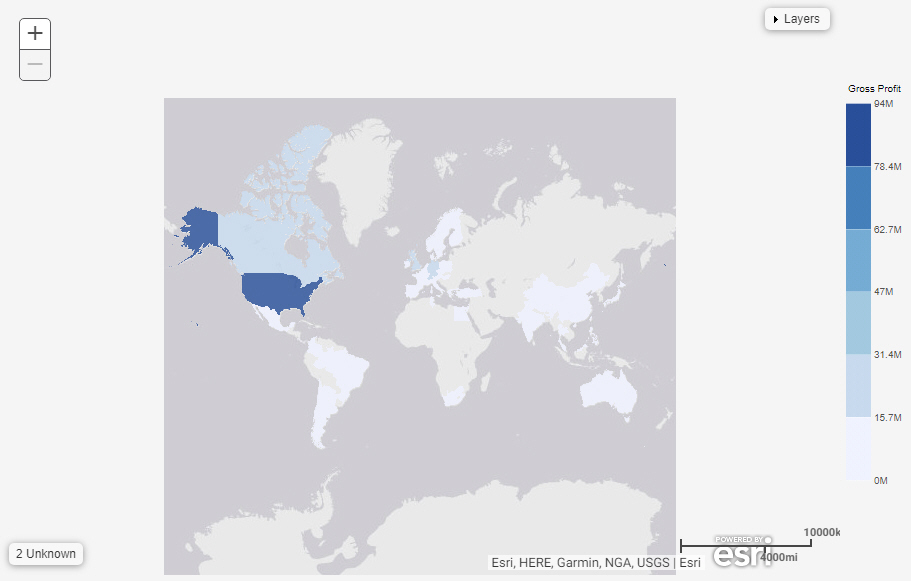
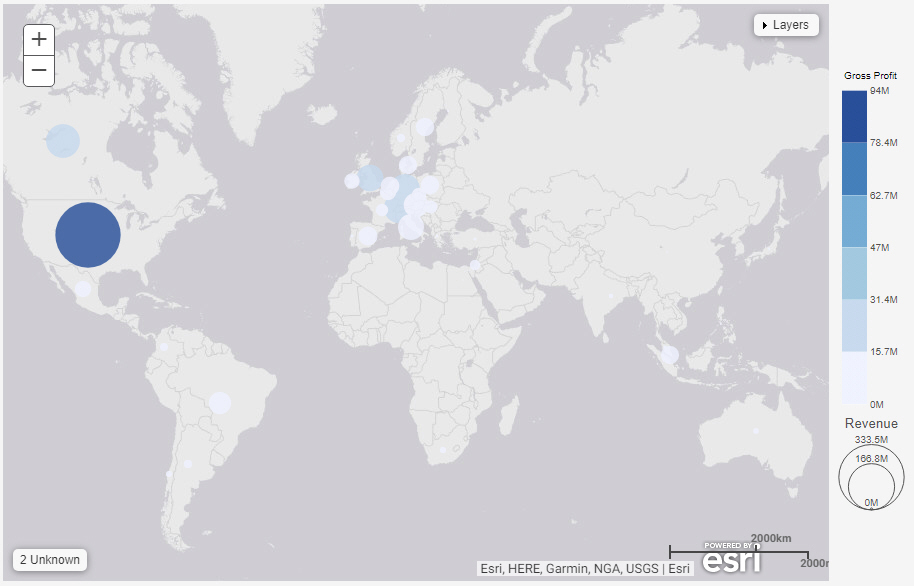
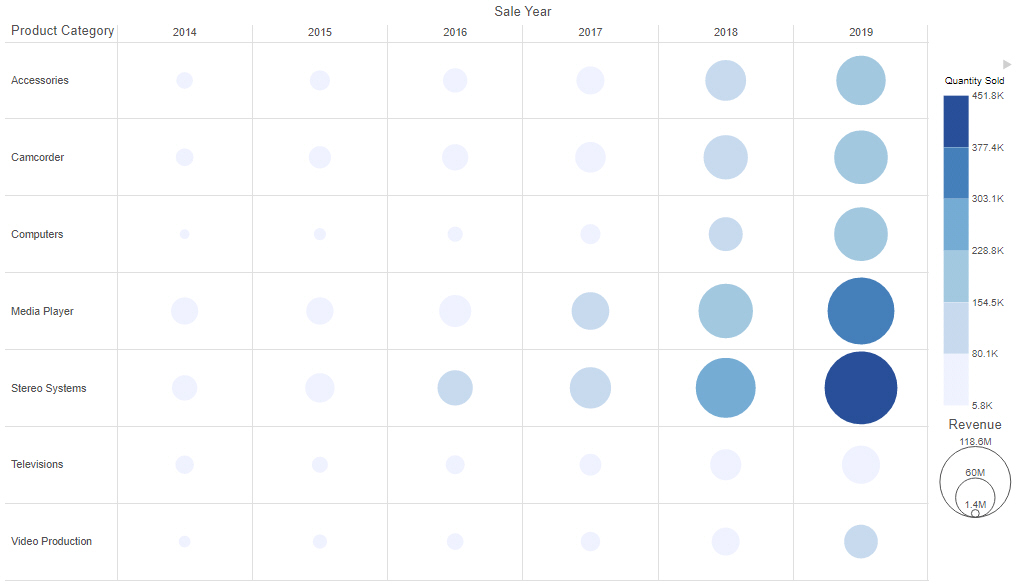
Formatting Legends in a Chart
In a chart, the legend identifies values according to the color-coded data values that display. The legend typically displays on the right side of the chart, but you can change the location using the formatting options. You can format a legend in any of the following ways: