Creating Charts Using a Chart Extension
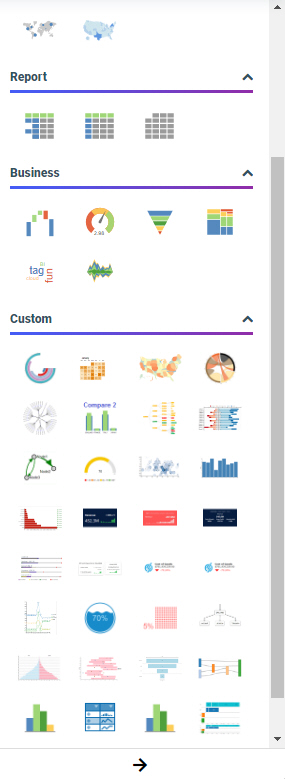
WebFOCUS supports the ability to add new, custom chart types to its list of built-in charts. These custom chart types are called extensions or plug-ins. Once enabled on your WebFOCUS environment, any extensions that you have added are available when you expand the Content picker, in the Custom section, as shown in the following image.
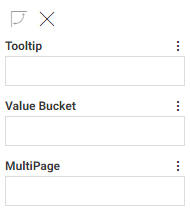
Each chart extension uses a set of buckets and properties unique to that extension. The liquid gauge chart extension uses the Tooltip, Value Bucket, and MultiPage buckets, as shown in the following image.
The chord diagram, on the other hand, uses the Source Nodes, Target Nodes, Node Link Values, and MultiPage buckets. It also indicates the type of field that should be used in each bucket, as shown in the following image.
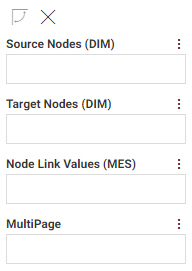
Each of these buckets is configured to allow a certain number of fields, and certain types of fields.
Chart extensions also have a unique set of properties that can be applied to them. To access chart extension properties, on the Format tab, with the General option selected from the Quick Access menu, in the Other section, click Extension properties. This opens the Extension properties panel. The Extension properties panel opens on top of the Resources and Properties panels, and can be resized and moved within the browser window. If you click outside of the Extension properties panel, it closes, and any changes that you made to the chart properties are applied.
The Extension properties panel for a liquid gauge chart is shown in the following image.

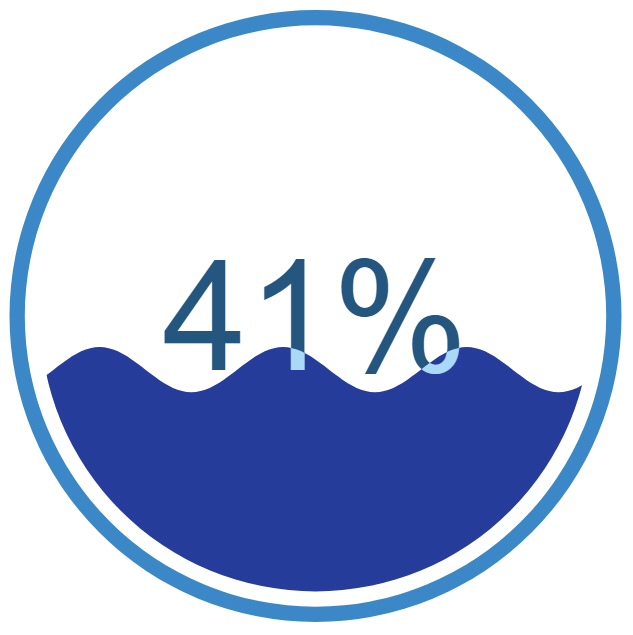
Some of the properties on the Extension properties panel apply to specific elements of the chart extension. For example, in the following image, the color of the wave in the liquid gauge chart has been changed to a darker shade of blue, and the number of waves has been increased from 1 to 3.
For more details about the buckets and properties used in specific chart extensions, see the page for each extension on the Information Builders GitHub site.
Procedure: How to Create a Chart Using a Chart Extension
- Open WebFOCUS Designer. On the WebFOCUS start page, click the plus menu and then click Create Visualizations, or, on the WebFOCUS Home Page, click Visualize Data.
WebFOCUS Designer opens in a new browser tab.
- Select a workspace and a data source available from that workspace.
Once you select a data source, WebFOCUS Designer loads with options to create a single content item.
- Expand the Chart picker and, from the Custom section, select a chart extension with which to create your chart.
- Add measure and dimension fields to the chart based on the available buckets.
- Optionally, style the chart using the available extension-specific properties.
- On the Properties panel, select the Format tab.
- If it is not already selected, open the Quick Access menu and select General.
- In the Other section, click Extension properties. The extension properties panel opens.
- Make changes to the desired properties, and then close the extension properties panel.
The chart updates to reflect your changes to extension properties.
- Save your visualization.
- Release: 8207
- Category: Visualizing Data
- Product: WebFOCUS Designer
- Tags: How-to's