Adding Headers and Footers to Content
You can use headers and footers to add key information, such as the purpose of your chart or report and the audience for whom it is intended.
You can add multiple lines of information into the heading and footing areas, and apply different styling options to different sections of the heading or footing. This accommodates thorough explanations and additional information, while offering the most readable presentation.
When you create a chart or report, the heading area is available above your content, and the report footer is available below your content. You can click within these areas to edit them. To show or hide these areas, on the Settings tab, expand the Content section, then select the Enable heading or Enable footing check boxes.
When you double-click the Page Heading or Page Footing placeholder text in the canvas, the heading or footing is selected for editing and the styling toolbar appears.
You can make styling changes to the text in your headers and footers, according to your preferences. Using a WYSIWYG canvas, formatting changes are applied instantly, allowing you to see the results of your styling selections as you make them. When editing your header or footer, you can find the options at the top of the canvas, as shown in the following image.
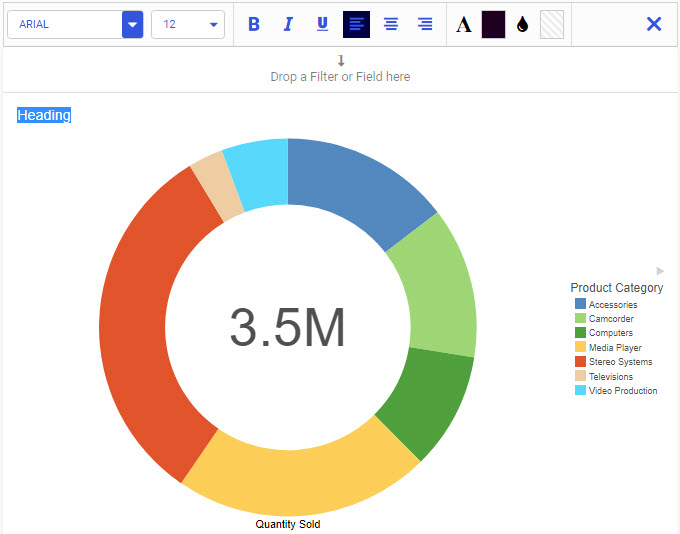
You can change the font and font size using the drop-down lists. You can add bold, italic, and underline accents to your text. In addition, you can change the positioning of your text (left, center, and right). You can also customize the color of the text, as well as the background of the header or footer text area. When your formatting is complete, you can close the toolbar and continue working with your report. The canvas adjusts to ensure that all lines of the heading or footing are visible.
You can add a new line in the heading and footing by pressing the Enter key. The number of lines of heading and footing you can add to a report is only limited by the available space on your screen. A scrollbar is added to a report if all of the data cannot fit on the canvas or in the container.
When you are done editing the heading or footing, click the X button on the styling toolbar to close it. Once you have edited the header or footer, the updated text will appear when the report is run.
If you delete the header or footer text and then close the styling toolbar, the header or footer is removed from the report. You can select the header or footer area and enter text to add them to the report again.
Heading and footing text in WebFOCUS Designer is created at the page level, so the heading or footing is displayed for each separate page of a chart or report. You can create separate pages in a chart by adding a field to the Multipage bucket, or in a report by right-clicking a field in the Rows bucket, pointing to Insert breaks, and selecting Continuous numbering or Restart at 1.
You can add dynamic heading or footing text by dragging a field from the Fields tab into the heading or footing text area, or by typing a less-than sign (<) followed by the field name. At run time, the first value for the selected field is displayed in place of the field name in the header or footer. You can combine dynamic page heading or page footing text with filters or page breaks to provide more relevant information at run time.
Procedure: How to Add a Dynamic Page Heading to a Report
You can add a dynamic page heading to a report that changes depending on filter selections and sort values for each page.
- Open WebFOCUS Designer. On the WebFOCUS start page, click the plus menu and then click Create Visualizations, or, on the WebFOCUS Home Page, click Visualize Data.
WebFOCUS Designer opens in a new browser tab.
- Select a workspace and a data source available from that workspace.
Once you select a data source, WebFOCUS Designer loads with options to create a single content item.
- On the Content picker, select a report format, such as the standard report or grid report layout.
- With the Fields tab selected on the sidebar, In the Dimensions area of the Resources panel, expand Product, and add the Product Category and Product Subcategory fields to the Rows bucket, in that order.
- In the Measures area of the Resources panel, expand Sales, and drag Quantity Sold and Revenue to the Summaries bucket.
- Create a filter for Customer Country.
In the Dimensions pane, expand Customer and drag Customer Country into the Filter toolbar.
- Select Argentina, and click outside of the filter control to apply the filter.
- Create a page break after each Product Category value.
Right-click the Product Category field in the Rows bucket, point to Insert Breaks, and click Continuous numbering.
- Double-click the Page Heading text above the report to select it for editing.
- Delete the placeholder text in the heading area, and type Sales for.
- From the Dimensions pane, drag the Product Category field into the heading area after where you typed Sales for.
The heading should resemble the following image. Dynamic values for the Product Category field will be substituted for the text string starting with the less-than sign (<) at run time.

- Click the close button on the styling toolbar to finish editing.
- On the Properties panel, on the Settings tab, expand the Settings area and select Enable footing.
The page footing placeholder text appears at the bottom of the page.
- Double-click the page footing area to select it for editing.
- Type, This report shows figures for sales in.
- From the Dimensions pane, drag the Customer Country field into the footing area after the text that you just typed.
The name of the field, with a less-than sign in front of it, appears in the page footing area.
- With the entire page footing text selected, click the Italic button on the styling toolbar.
- Click Run in new window to see a run-time view of the report.
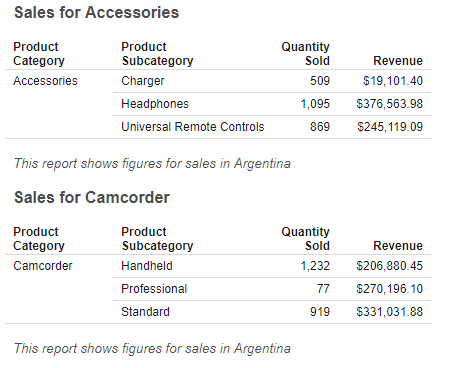
Notice that the page header appears and displays a different value for each Product Category value. The Page footer appears below each section of the report, and indicates that values are for Argentina, since this was the value selected for the Customer Country filter. If you were to select a different value for Customer Country, the footing text would automatically change.
The following image shows an example of what a section of the report may look like.
- Release: 8207
- Category: Visualizing Data
- Product: WebFOCUS Designer
- Tags: How-to's