Configuring the Automatic Refresh Option for Charts
WebFOCUS Designer allows you to integrate real-time streaming data with your charts using the Automatic refresh option. For example, for IoT analytics applications, if you configured a connection to a streaming data source using the Kafka adapter, the Automatic refresh option can be enabled to update your chart dynamically at a specified interval (in seconds). Depending on your specific use case or requirements, you can configure multiple charts using the Automatic refresh option and add them to a page, portal, or workbook. Each chart will refresh independently with updated data based on the specified refresh rate.
Considerations
As of WebFOCUS Designer 8207, the Automatic refresh option is supported for all chart types, except for maps (for example, Proportional Symbol and Choropleth maps). The Automatic refresh option is not available for reports in WebFOCUS Designer. In addition, this option is not included in InfoAssist. Automatic refresh is only supported for stand-alone charts. If you convert the chart to a page, a warning appears, alerting you that automatic refresh will not be carried over.
Procedure: How to Enable and Configure the Automatic Refresh Option for a Chart
- Create a new chart in WebFOCUS Designer. To best utilize the automatic refresh feature, use a streaming data source, such as one using the Kafka adapter.
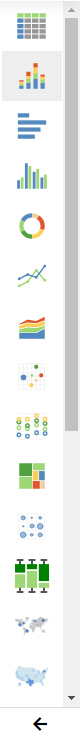
- Choose a chart type from the chart picker, as shown in the following image.
- Add measures and dimensions according to your requirements by dragging them onto the canvas.
Note: You can also double-click a measure or dimension to add it to the relevant bucket or drag it into the relevant bucket.
- Apply any required formatting or styling to your chart (for example, adding a header or footer).
- To turn on automatic refresh, on the Settings tab, expand the Content section. Select the Enable auto-refresh check box, as shown in the following image.
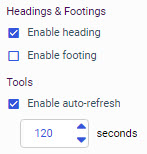
- By default, the refresh interval is set to 120 seconds. Use the spinner or type a value to specify the refresh rate in seconds, which is the period of time to wait until the chart polls the corresponding data source to reflect any updated data.
Note: You can specify a maximum value of 120 seconds (two minutes) as the refresh rate.
- Click OK.
You can continue to build and modify your chart as required.
- When you are finished, click Save on the WebFOCUS Designer toolbar to save your chart.
- To test and verify that your chart is being refreshed correctly, locate it on the Home Page, right-click it and select Run from the context menu.
Observe your chart while it is running and make a note of any adjustments that should be made. For example, if the chart is being refreshed too quickly, then you should consider increasing the number of seconds specified for the Automatic refresh option.
Procedure: How to Disable the Automatic Refresh Option for a Chart
To disable the Automatic refresh option:
- Open a visualization that uses automatic refresh. On the WebFOCUS start page, right-click a visualization and click Edit.
The selected visualization opens in WebFOCUS Designer.
- On the Settings tab, expand the Content section.
- Clear the Enable auto-refresh check box.
- Save your content. When it is run, your content no longer refreshes automatically.
- Release: 8207
- Category: Visualizing Data
- Product: WebFOCUS Designer
- Tags: How-to's