Filtering a Chart with Visual Selections
You can visually create prompted filters by selecting areas of a chart directly from the canvas as you create it, as well as at run-time. This is called on-chart filtering. Since on-chart filtering is performed based on visual selections on a chart, they are quick and intuitive to create. On-chart filters created from one item immediately affect all other content created on the page, allowing you to see the impact of your filter immediately. On-chart filtering is available from pages containing one or more new content items, and from stand-alone charts created using the AHTML output format.
On-chart filtering is enabled in applicable content types by default. To disable on-chart filtering, open the Filter options menu and deselect Use content as filters.
To use on-chart filtering, select one or more areas of a chart by clicking a single section or by clicking and dragging, or lassoing, an area of the chart. The selected sections of the chart are highlighted, and a tooltip appears with information about the selected area, as shown in the following image.
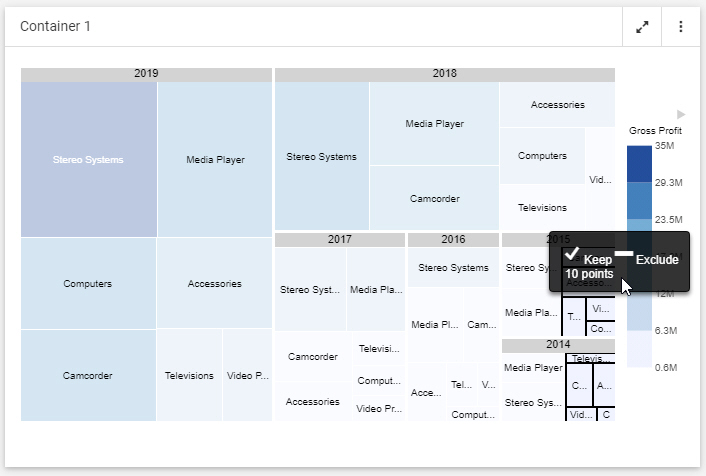
From the tooltip, you can filter the entire visualization for the data that you selected in the chart. Click Keep to create a prompted filter for the selected values, or click Exclude to create a filter that excludes the selected values.
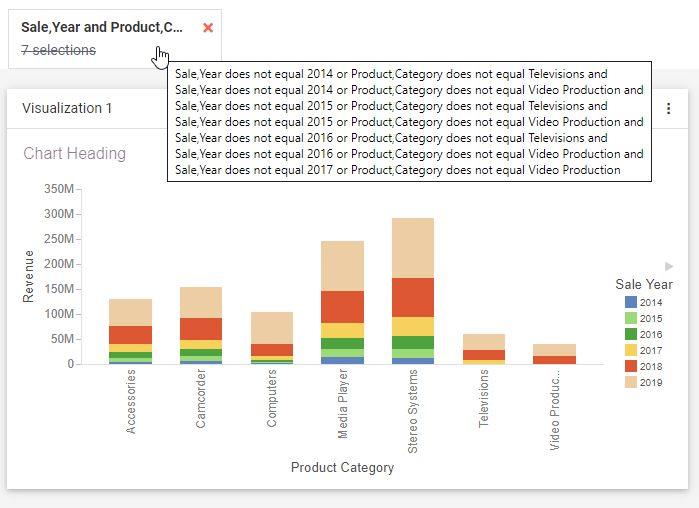
You can create several filters using on-chart filtering to further refine the data that you display in the visualization. Each of these filters affects every item on the page. When a filter is created, it is added to the Filter toolbar. If the filter applies to a single dimension, you can click the filter label in the toolbar to edit it. If the filter is applied to multiple dimensions, such as a bar chart with one dimension in the Horizontal bucket and another dimension in the Color bucket, then filter is not editable from the Filter toolbar. However, you can point to it to see a tooltip listing the filter selections, as shown in the following image.
You can right-click the filter label at design time to delete the on-chart filter or swap between keeping and excluding the selected values. You can also delete a filter created with on chart filtering by selecting an area of the chart and clicking Remove Filter on the tooltip, or by clicking the X on the filter control in the Filter toolbar. The visualization restores the values previously hidden by the on-chart filter.
On-chart filtering works similarly at run time. When you run a visualization, you can click or lasso different areas of a chart to dynamically filter the entire page.
- Release: 8207
- Category: Visualizing Data
- Product: WebFOCUS Designer