Using the Data Tab
To access the Data tab, select DATA on the WebFOCUS Designer toolbar.
The WebFOCUS Designer Data tab with a single synonym on the canvas is shown in the following image.
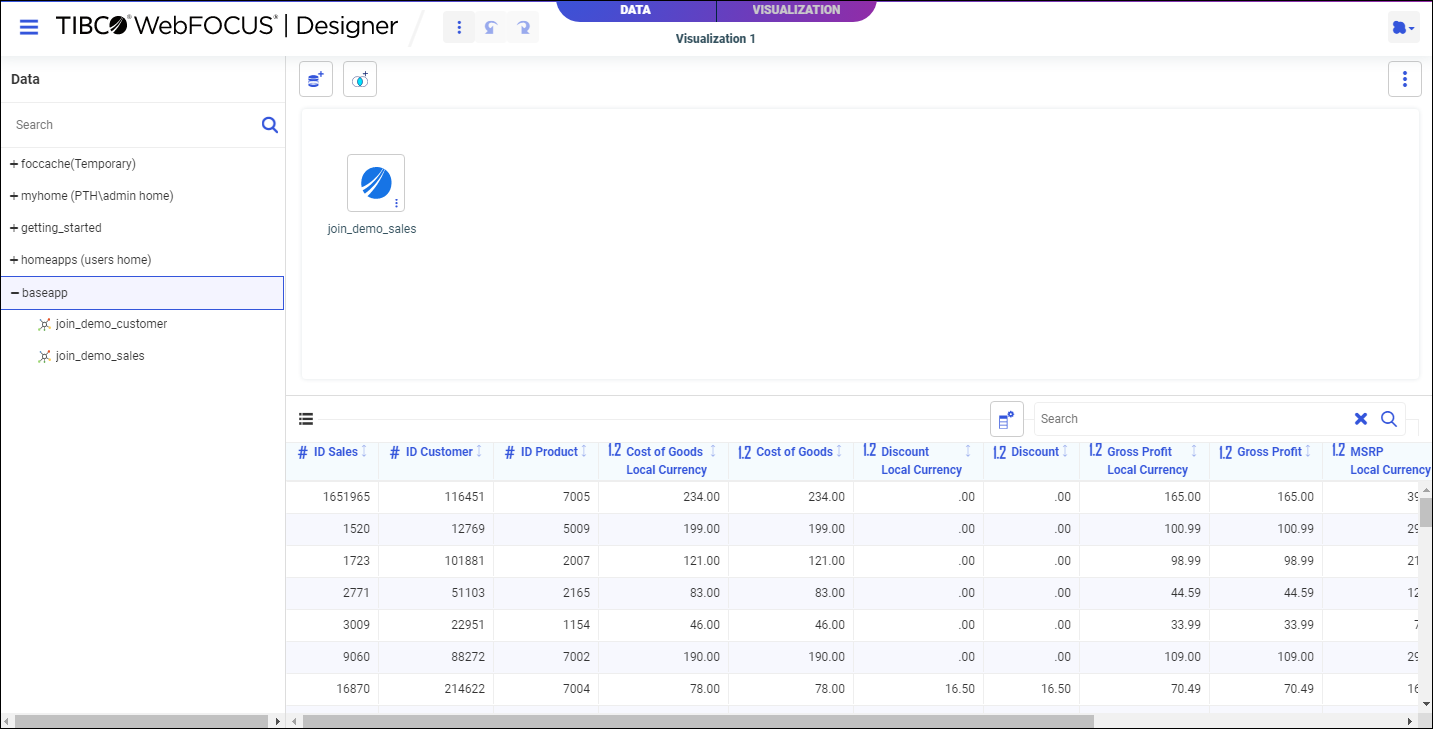
The Data tab includes the following tools and components.
Before you load data into your target data source, you can enhance it for your needs in a process called data preparation, which features options allowing you to convert numeric codes into meaningful attributes, discard erroneous data, smooth ragged data out into manageable bins, and blend descriptive data from additional sources. You can also use data preparation calculations to create new fields.
You can access data preparation options when you create a new data flow from the Applications page by clicking New and selecting Flow.
To access the Data tab, select DATA on the WebFOCUS Designer toolbar.
The WebFOCUS Designer Data tab with a single synonym on the canvas is shown in the following image.
The Data tab includes the following tools and components.
In Document mode, you can:
A blank InfoAssist canvas in Document mode is shown in the following image.
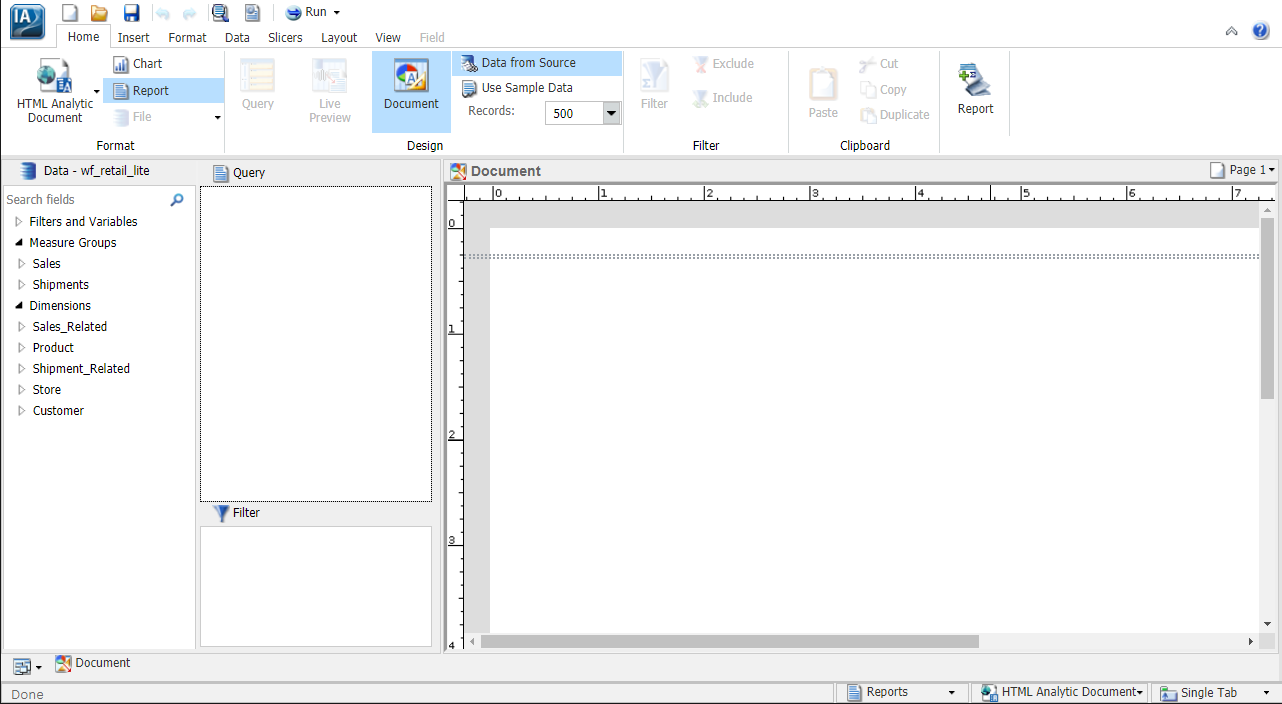
You can build new documents by accessing Document mode from the InfoAssist splash screen.
You can create customized report outputs in InfoAssist. The standard output formats, which are found in the Format group on the Home tab, include: HTML, HTML Analytic Document, PDF, PDF Analytic Document, Excel, and PowerPoint. For charts, HTML5 is the default output format. For reports, you can also create the following custom report output formats from the Navigation group on the Format tab, including: Table, Table of Contents, Freeze, Pages on Demand, and OLAP.
You can use the following procedures to create a basic report in the WebFOCUS Home Page and InfoAssist.
After you have signed in to WebFOCUS, you can work with an existing folder, or create a new folder in the WebFOCUS Home Page to store your reports.
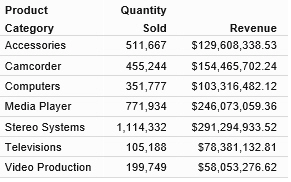
A basic report is shown in the following image.
You can use the following custom features when creating reports.
You can apply custom styling to specific areas of a report. When creating a report, you can perform the following styling customization.
The Storyboard feature allows you to capture and preserve snapshots of your visualizations as you create them.
Each time you add something to the storyboard, it is placed onto a unique PowerPoint slide. When you click Show, you can open and review your slides in PowerPoint.
Since storyboards give you the ability to turn your visualizations into a PowerPoint presentation, you can modify your storyboard to create a customized demo. For example, you can rearrange or delete slides, or add titles and text.
Using an integrated workflow, you can create a visualization in WebFOCUS Designer from top to bottom. You can start by selecting a data source, joining additional data sources, creating multiple content items, and organizing them on a page. You can also utilize numerous customization options, from a wide selection of chart types, to various filtering options, and even custom CSS and JavaScript to make your visualization your own.
The GEO configuration editor in the WebFOCUS Server provides a tool for editing or adding properties for geographic roles.
On the WebFOCUS start page, from the Management Center, click Server Workspaces to access the WebFOCUS Reporting Server Workspace area. Alternatively, from the WebFOCUS Home Page, click the Settings menu and click WebFOCUS Server. When the WebFOCUS Reporting Server browser interface opens, open the Tools menu and click Workspace. The Workspace area opens.