8207


Video: Enhanced Designer Workflows and UI

Using an integrated workflow, you can create a visualization in WebFOCUS Designer from top to bottom. You can start by selecting a data source, joining additional data sources, creating multiple content items, and organizing them on a page. You can also utilize numerous customization options, from a wide selection of chart types, to various filtering options, and even custom CSS and JavaScript to make your visualization your own.

Editing Metadata

Metadata is data about data, and describes the characteristics of your data sources, or synonyms. Metadata can be generated whenever data is created, acquired, added to, deleted from, or updated.

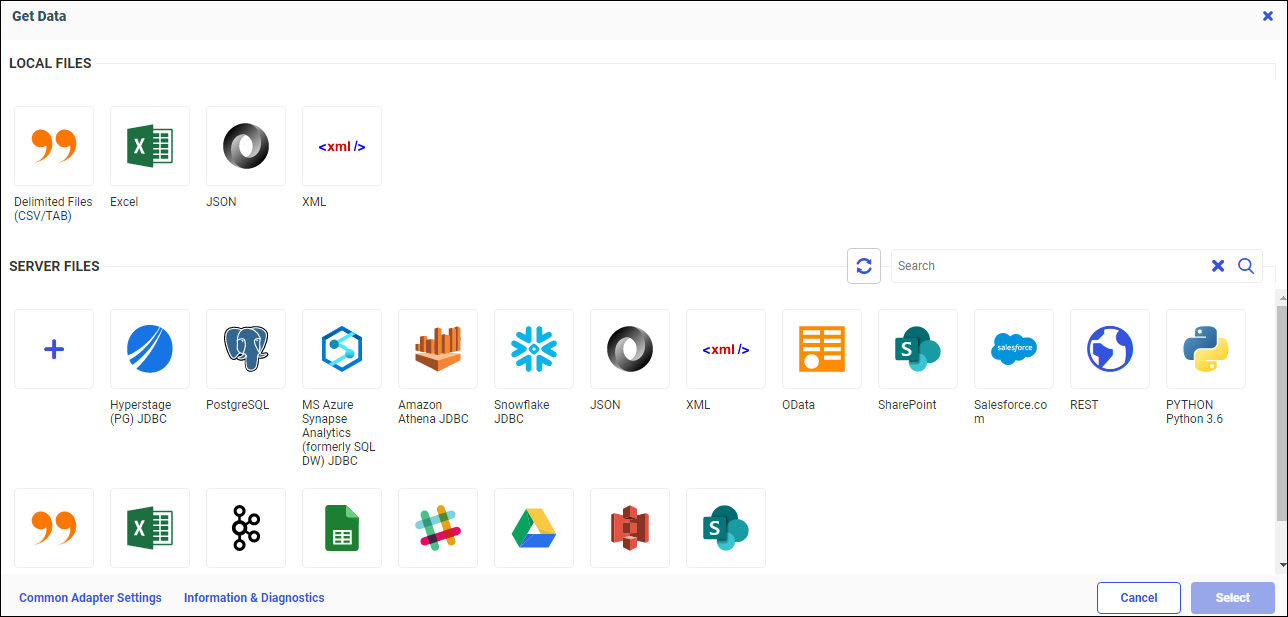
Depending on your version of WebFOCUS and your permissions, you may have access to additional metadata options, so you can edit previously created synonyms.

You can edit previously created synonyms in the following ways:

Pivoting Data

Some data files may contain repeating values, such as sales figures for a series of years. When uploading a spreadsheet or delimited file with columns of repeating values, you can preview these columns and transform them into rows.

Procedure: How to Pivot Columns Into Rows

  1. On the WebFOCUS home page, click the Get Data button .

    The Get Data dialog box opens, as shown in the following image.

Joining Data

You can Join data sources from the data tab in WebFOCUS Designer, and then use your joined data to create new content from within the Visualization tab.

The joined data structure is not applied permanently to the metadata. This allows you to virtually join multiple data sources as if they were a single data source, from which you can report in a single request. This can increase the number of relevant fields available for use in your content, giving you an expanded selection of data specific to your charting purposes.

Navigating the Home Page

The Home Page is the default landing page that opens when you first sign in to WebFOCUS. It serves as a centralized place for working with your data, creating, organizing, and sharing content, scheduling reports and procedures, and performing administrative tasks. These functions are controlled by the permissions that are assigned to the role of a user. To learn more about the available roles in WebFOCUS, see WebFOCUS Security and Administration technical content.

Connecting to Data Files

You can connect to various data sources and create synonyms, configure new adapters, add connections to existing adapters, or change adapter connections. Then use your connected data for content creation or analysis.

Procedure: How to Connect to Data Files

  1. On the WebFOCUS start page, click the plus menu, and then click Get Data, or, on the WebFOCUS Home Page, click the Get Data button .

Uploading Data Files

You can upload delimited, Excel, JSON, or XML files into WebFOCUS, where you can preview and modify the data before loading it to a database, then create visualizations or prepare it for future analysis.

Procedure: How to Upload Data Files

  1. On the WebFOCUS start page, click the plus menu, and then click Get Data, or, on the WebFOCUS home page, click the Get Data button .

    The Get Data dialog box opens, as shown in the following image.

Adding a Custom Geographic Role

The GEO configuration editor in the WebFOCUS Server provides a tool for editing or adding properties for geographic roles.

On the WebFOCUS start page, from the Management Center, click Server Workspaces to access the WebFOCUS Reporting Server Workspace area. Alternatively, from the WebFOCUS Home Page, click the Settings menu and click WebFOCUS Server. When the WebFOCUS Reporting Server browser interface opens, open the Tools menu and click Workspace. The Workspace area opens.

User Options in Phone Mode

You have a number of options in Phone mode, including robust filtering and hover capabilities.

Filtering

In Phone mode, you can filter just like in regular desktop mode. The primary difference is that the filter shelf stacks the available filters in a vertical row, as shown in the following image.

Using Insight in Phone Mode

Phone mode, which is available in Insight, allows you to take advantage of the features of Insight on your phone. The interactive heading that is available in Insight on a tablet or desktop is replaced by a static heading that displays the field names in the chart, in blue text. These become summary fields that allow you to see what fields are included in the chart.