8207


Using Your Extension in a WebFOCUS Request

If you have installed and configured your extension as described, your extension will be available for use in the WebFOCUS tools as a chart type in the Other format category under HTML5 Extension, as shown in the following image.

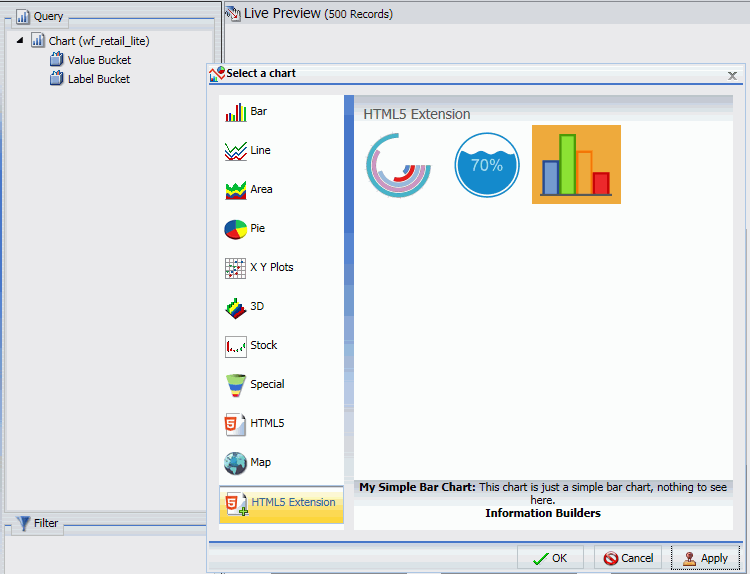
When creating a chart using WebFOCUS Designer, chart extensions are available in the Custom category when you expand the chart picker, as shown in the following image.

Configuring an Esri On Premise Environment

The Esri On Premise functionality enables you to download and access mapping files through the use of a local Application Programming Interface (API). Once you download and configure the API, you do not need an internet connection to utilize the robust mapping features that Esri provides. For information on downloading and configuring the API that controls this feature, see How to Download and Configure the ArcGIS JavaScript API.

WebFOCUS Server Adapter for Esri ArcGIS Configuration for Demographic Layers

In order for demographic layers to draw, you must configure the WebFOCUS Server to enable them. Some features, such as demographic and reference layers that require authentication and certain simplified geography functions, may additionally require a refresh token. You can acquire the refresh token using your Esri ArcGIS credentials.

A Brief History of Mapping

An early example of how maps can be used to illustrate trends is the case of Dr. John Snow, an epidemiologist who was one of the first to use data to map occurrences of cholera to find the cause of infection. By plotting the cholera data on a map of a town, Dr. Snow was able to visualize a trend that showed higher incidences of cholera closest to water pumps. This example is shown in the following image.

Creating Maps to Illustrate Trends

You can create maps to identify patterns or trends in your data. By converting data into values that can be displayed on a map, you are able to visualize scenarios, illustrate hot spots, and identify potential problem areas. For example, a law enforcement agency may use mapping functionality to identify areas of higher crime within the locations they cover. You can also use maps to determine how places are related, understand where things are located, and identify the best actions to take.

Using the Editor

The Editor enables you to create, view, and edit the source code for WebFOCUS procedures (FOCEXECs), Master, HTML, JavaScript, WebFOCUS StyleSheet, Cascading Style Sheet, Text, SQL, R, and Python files.

Additionally, the Editor supports user-friendly features, such as syntax highlighting, code folding, line numbering, autocomplete, and display of a status bar and indent guides. These features speed productivity by enabling better clarity in helping you understand, debug, and work with your source code.