WebFOCUS Designer and Esri Integration
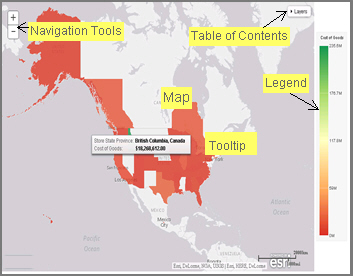
Using WebFOCUS Designer with the Esri integration, you can create maps that help you illustrate or identify trends so you can take action quickly. WebFOCUS architecture provides the framework in which this system operates. Using a JavaScript map viewer, you can navigate the interface easily, as shown in the following image.
In addition, this integration utilizes the capabilities of Esri by leveraging the ArcGIS JavaScript API and content. Specifically, you can integrate data into maps with published content in ArcGIS Online platform. For more information, see http://www.esri.com/software/arcgis/arcgisonline. Additionally, by using this integration, you can include information about demographics, spending habits, crime, and lifestyle to maps that contain your data. These maps include layers with extensive demographic or reference detail and topography and allow you to view information about people, businesses, climate, and much more.
You can create the following maps in WebFOCUS Designer:
- Choropleth. A common thematic map that uses geographical measures (for example, states and countries), representing the values aerially while employing a varying intensity of colors. It is useful for visualizing location-based data, trends, and distributions across a geographic area. The color hues for Choropleth maps are dictated by the legend, based on the selected measure, enabling you to determine data concentration across your map.
- Proportional Symbol (Bubble). A map that represents coordinates, such as an address or intersection, using symbols of different sizes to represent any measure. These maps focus on specific areas, for which data concentrations may vary. When the data concentration is larger, the bubble will be bigger.
In addition, built-in zooming capabilities allow you to drill down to a specific geographic area of focus easily. This allows you to get a closer look at regional or local data, draw inferences, and make recommendations, without changing the initial view of your data.
Using the Esri integration in WebFOCUS Designer, you can also add the following layers to your map:
- Backgrounds. Display a layer that positions data as it is located, in context to other geographical features, such as streets, terrain, and imagery. Some standard Background options may combine road, aerial, and topographic data using a variety of symbols. Hosted on ArcGIS, you can change your background at any time, to review your data in a different context.
When you apply a Background to your map, its appearance changes. You can then adjust the view of your data, showing different terrain or geographical views. Backgrounds provide at least 17 levels of zoom. For more information, see https://developers.arcgis.com/javascript/jsapi/esri.basemaps-amd.html.
The basemap options include:
- Light Gray Canvas Map
- Dark Gray Canvas Map
- World Imagery with Labels
- National Geographic World Map
- Oceans Map
- Open Street Map
- World Imagery
- World Street Map
- Terrain with Labels
- World Topographical Map
- Reference Layers. Display a layer of boundaries and locations that range from a continental scale to country, state, and even local neighborhood. For example, if you are viewing World data on electricity usage, you may want to add a Reference Layer that displays the borders and concentration of your data within each country.
- Demographic Layers. Display a layer of information about people and businesses in a specific demographic area. This includes the United States and 120 other countries. Demographic Layers are thematic maps that provide additional information about the location, such as spending habits, population, and lifestyles. You can add Demographic Layers to a map about sales data, to identify new locations for stores, based on the spending habits for a specific area.
Both mapextent and the Layers menu functionality are applied to your map when you select a Background, Reference Layer, or Demographic Layer. Mapextent is an automatic view of the map. Layers is a menu that appears on the map and provides access to options that allow you to adjust the information that is being displayed.
The map example in the following image shows the use of layers.

Note: Backgrounds, Demographic Layers, and Reference Layers can be accessed from the Format tab. These layers are static, standard options that Esri provides for use with WebFOCUS Designer, and do not change based on the data source that you select.
- Release: 8207
- Category: Visualizing Data
- Product: WebFOCUS Designer