A Brief History of Mapping
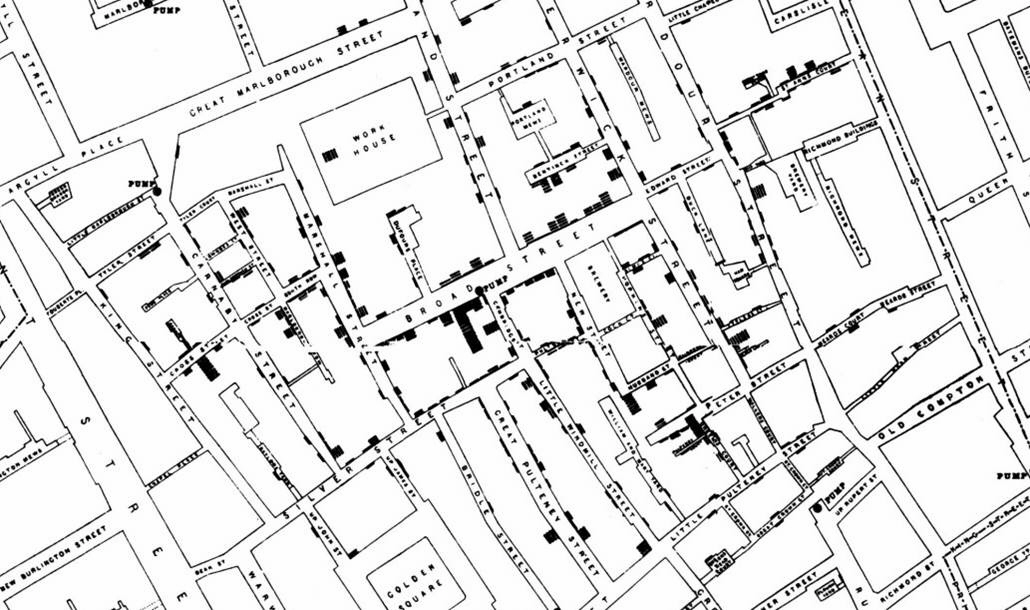
An early example of how maps can be used to illustrate trends is the case of Dr. John Snow, an epidemiologist who was one of the first to use data to map occurrences of cholera to find the cause of infection. By plotting the cholera data on a map of a town, Dr. Snow was able to visualize a trend that showed higher incidences of cholera closest to water pumps. This example is shown in the following image.
Maps also allow you to measure size, shape, and distribution to detect and quantify patterns, and even perform predictive analytics. An example of how maps can help detect and quantify patterns is the scenario in which a state agency used a mapping application to solve a problem with their food stamp system. Using this application, odd food stamp redemptions, such as rounded numbers transactions, were discovered. By plotting those transactions on a map, the agency discovered that the redemptions appeared in the same geographic location. Upon further investigation, the agency identified that individuals were selling their food stamps at reduced prices, $50 worth of food stamps for $40 in cash, to others instead using them as intended. This map example is shown in the following image.

When working with maps, the concepts of location intelligence and business intelligence are important to understand. A Geographic Information System (GIS) captures, stores, analyzes, manages, and presents data linked to a location, while Business Intelligence (BI) relies on the conversion of raw data into meaningful information. Location intelligence is the process of analyzing data to make better business decisions. It combines GIS and BI/Analytics to allow the recognition of patterns in your data, including the visualization and discovery of geospatial outliers, which would not be easily discovered if you use the technology independently and separately.
More specifically, maps use non-intrusive GIS workflows with existing data. You can view symbol layers for data-bound to a geo-location, such as state, country, and ZIP code, in an integrated map viewer. Using metrics from your data, you can also visualize geographic roles or dimensions. Geographic roles, or dimensions, can be built directly into your Metadata or assigned to a data field when you create a map.
- Release: 8207
- Category: Visualizing Data
- Product: WebFOCUS Designer