Creating and Customizing Maps in WebFOCUS Designer
The following procedures provide step-by-step instructions on how to create and customize maps.
As you create your maps, you can use the following built-in map viewer features:
- You can use the plus (+) and minus (-) symbols
 within the map to zoom in and out of different areas of the map. You can also click your left mouse button to zoom in to a specific location.
 - Like all HTML5 visualizations, the highlighted markers and regions on a map support drill, multi-drill, auto-linking, and informational tooltip features.
- You can use the Pan/Selection button to alternate between the Pan and Selection controls. This option is in the upper-right corner of the map.
- Creating a map chart using the US Zipcode 5 Georole with more than 2000 polygons will fail to draw.
Procedure: How to Create an Esri Choropleth Map
Note: The default option of creating a map utilizes the ArcGIS JavaScript API that Esri provides.
- Open WebFOCUS Designer. On the WebFOCUS start page, click the plus menu and then click Create Visualizations, or, on the WebFOCUS Home Page, click Visualize Data.
WebFOCUS Designer opens in a new browser tab.
- Select a workspace and a data source available from that workspace.
Once you select a data source, WebFOCUS Designer loads with options to create a single content item.
- On the Content picker, select the Choropleth map chart type.
A blank map displays and the Location bucket is enabled, as shown in the following image.

- Add a Geolocation field to the Location bucket.
This field, which already has a geographic role assigned, is denoted with a Geo icon,
 , in the Resources panel.
The canvas refreshes, and your map displays.
- Before saving your map, to add insight, you can also do the following:
- Click Run in new window, to see a run-time view of your map.
- Add a measure or dimension to the Color bucket, to color your chart by that underlying data value. When you add a dimension field to the Color bucket, a legend displays for the values in that field. Note that each area in a choropleth map can only display one color at a time, so it may be preferable to use a dimension for which each geographic area will return a single value. If you specify a measure in the Color bucket, a color scale is generated.
- Add a field to the Tooltip bucket, which will display tooltip information when you place your mouse over an area of the map.
- Add a Background, Demographic Layer, or Reference Layer from the Format tab, under Map options.
- Click Save to save your map.
Procedure: How to Create an Esri Proportional Symbol (Bubble) Map
- Open WebFOCUS Designer. On the WebFOCUS start page, click the plus menu and then click Create Visualizations, or, on the WebFOCUS Home Page, click Visualize Data.
WebFOCUS Designer opens in a new browser tab.
- Select a workspace and a data source available from that workspace.
Once you select a data source, WebFOCUS Designer loads with options to create a single content item.
- On the Chart picker, select Proportional Symbol for the map type.
A blank map displays and the Location bucket is enabled.
- Place a data field with a defined geographic role in the Location bucket.
This field, which already has a geographic role assigned, is denoted with a Geo icon
in the Data panel.A basic bubble map displays, as shown in the following image.

- Before saving your map, to add insight, you can also do the following:
- Click Run in new window, to see a run-time view of your map.
- Add a measure or dimension to the Color bucket to color your chart by that underlying data value. Adding a dimension creates a legend with a different color assigned to each value. Adding a measure generates a color scale.
- Add a measure to the Size bucket, to control the size of the bubbles on your map.
- Add a field to the Tooltip bucket, to display tooltip information when you place your mouse over an area of the map at run time.
- Add a Background, Demographic Layer, or Reference Layer from the Format tab, under Map options.
- Click Save to save your map.
Procedure: How to Change the Default Background of a Map
- Create a new map or open an existing map.
- On the Format tab, on the Map options tab, select Base map and choose from the available options, as shown in the following image.
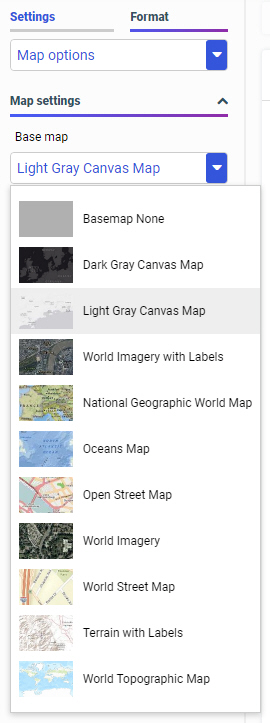
- Select one of the following options:
- World Street Map
- Terrain with Labels
- Oceans Basemap
- OpenStreetMap
- World Imagery
- Imagery with Labels
- Light Gray Canvas
- National Geographic World Map
- Dark Gray Canvas
- None
Note: The Imagery with Labels Background provides the terrain for your map, ranging from land contours to city streets.
Once you make a selection, the background of the map refreshes. You can continue to change your background until it displays the desired information.
Procedure: How to Add Demographic Layers to a Map
- Create a new map or open an existing map.
- On the Format tab, in the Map options group, click the Demographic layer drop-down and click Demographic Layers.
- Select from various population and lifestyle groups, as shown in the following image.
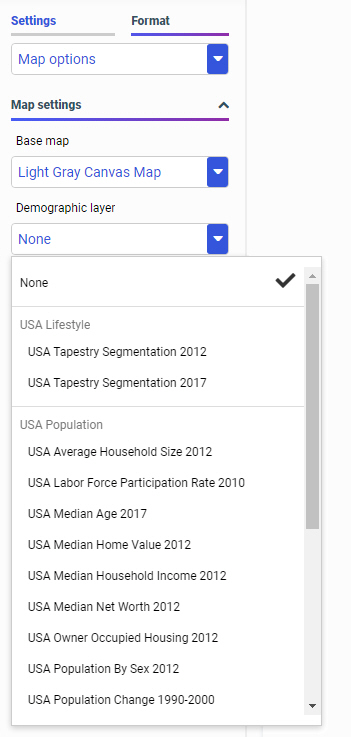
Note: These are pre-defined demographic profiles, provided by ArcGIS. You can select multiple options in either category to gain additional insight into your data. Specifically, each Demographic Layer has its own profile and provides a layering option, when comparing values across different layers or profiles.
- Click OK.
The Demographic Layers that you select are applied to your map. The map engine displays the different groups with unique hues and coloring. You can use the Table of Contents or Layers option, to toggle between the different layers that you have specified. The Layers option is shown in the following image.
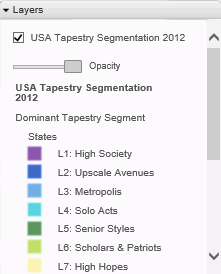
Note: You can select and clear the check boxes to enable the display of one or more Demographic Layers to compare and contrast the different demographic scenarios.
Procedure: How to Add Reference Layers to a Map
- Create a new map or open an existing map.
- On the Format tab, in the Map options group, click the drop-down for Reference layer.
The list of Reference Layers displays, as shown in the following image.
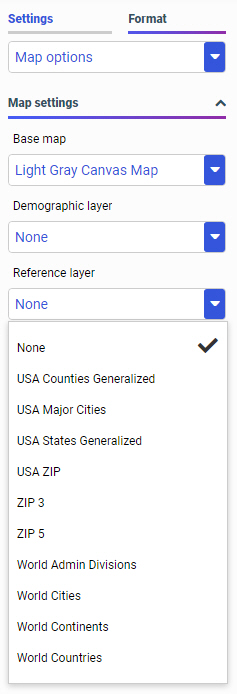
- Select one or more Reference Layers, such as World Countries, to add to your map, and then click OK.
Your map refreshes, and the definitions and borders of the References Layers display on the canvas. You can use the Table of Contents or Layers option, to toggle different Reference Layers in your map. These options are shown in the following image.

Reference: Query Buckets by Map Type
This section presents the Query buckets that display, by map type.
|
Query bucket |
Choropleth Map |
Proportional Symbol Map |
|---|---|---|
|
Geo. One data field, specifically a field containing location data (for example, State). |
|
|
|
Color. One data field. |
|
|
|
Tooltip. Up to one data field (not required). |
|
|
|
Multi-page. Up to one data field (not required). |
|
|
|
Size. One data field. |
|
|


Reference: Geographic Roles
Geographic roles have been unified to access 58 world administrative boundaries down to the postal code level, out of the box.
Note: Geographic roles are only available with Esri maps.
This section contains information on the geographic roles that are supported for Esri maps.
|
Geographic Role |
Description |
Maps Supported |
|---|---|---|
|
CONTINENT |
World Continents |
Choropleth, Proportional Symbol |
|
COUNTRY |
World Countries |
Choropleth, Proportional Symbol |
|
STATE |
World Admin Divisions |
Choropleth, Proportional Symbol |
|
CITY |
World Cities |
Proportional Symbol |
|
COUNTY |
World Counties |
Choropleth, Proportional Symbol |
|
POSTAL-CODE |
Postal Code |
Choropleth, Proportional Symbol |
Note: This is a new, simplified list of geographic roles (dimensions) that you can utilize when creating a map chart. This unified list of roles provides worldwide mapping of administrative boundaries down to the postal code level. In WebFOCUS Designer, the new roles display, by default, when assigning a geographic role.
The following table illustrates the geographic roles and their dependencies. Level 1 indicates the highest level of hierarchy and level 5 is the lowest level of hierarchy.
|
Region |
Hierarchy Level |
Geographic Role |
|---|---|---|
|
World |
1 |
CONTINENT |
|
2 |
COUNTRY |
|
|
3 |
STATE |
|
|
4 |
CITY |
|
|
5 |
POSTAL CODE |
- Release: 8207
- Category: Visualizing Data
- Product: WebFOCUS Designer
- Tags: How-to's