Adding Headings and Footings to a Chart
You can use headers and footers to add key information, such as purpose of the chart and the audience. For example, if you have gross profit for different product categories, you can add a header to highlight this information in your chart.
You can add multiple lines of information into the heading and footing areas in a chart. This accommodates thorough explanations and additional information while offering the most readable presentation.
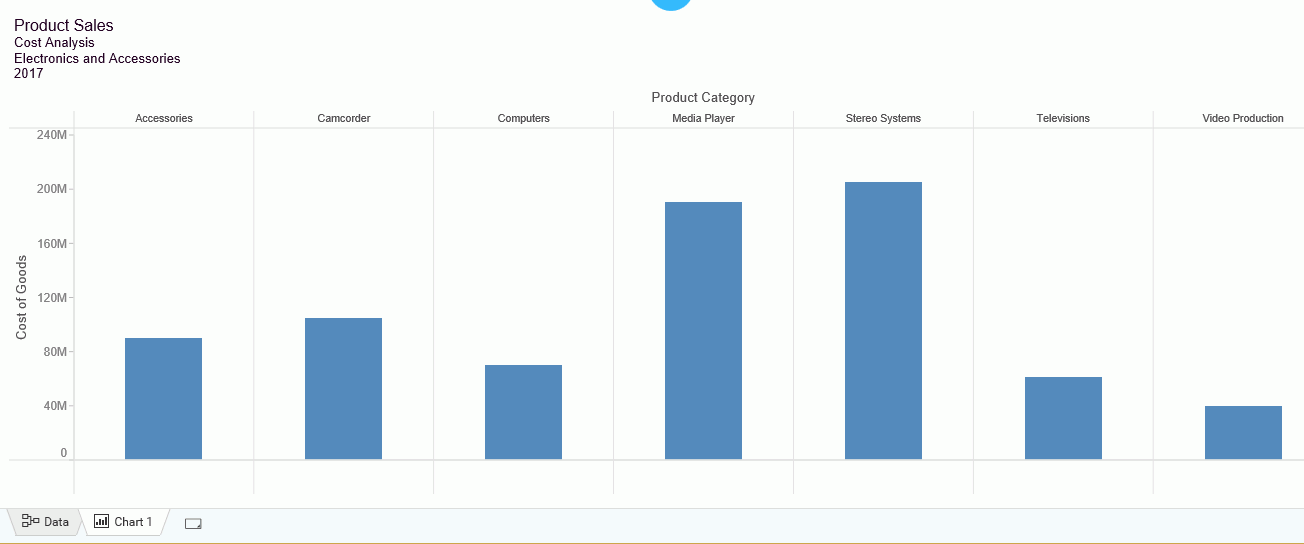
You add a new line in the heading and footing by pressing the Enter key. The number of lines of heading and footing you can add to a chart is only limited by the available real estate on the chart. The chart body will adjust to fit within the available space with the heading/footing lines inserted. You can change the font size or other presentation aspects using the editing toolbar that displays. When you are finished editing the heading and footing and edit mode is closed, the chart canvas adjusts to ensure that all lines of the heading or footing are visible, as shown in the following image.
Headers and footers can contain the same type of information. Footers are not enabled, by default, but can be enabled on the Quick Access Toolbar, as shown in the following image.

You can make styling changes to the information in your headers and footers, which allows you to interactively style the text according to your preferences. Using a WYSIWYG canvas, it delivers formatting changes instantly, allowing you to see the results of your selections as you make them. When editing your header or footer, you can find the options at the top of the canvas, as shown in the following image.

You can change the font and font size using the drop-down lists. You can add bold, italic, and underline accents to your text. In addition, you can change the positioning of your text (left, center, and right). You can also customize the color of the text, as well as the background of the header or footer text area. When your formatting is complete, you can close the toolbar and continue working with your chart.
Note: You can double-click the heading or footing to resume modifications at any time.
Procedure: How to Add Headings and Footings to a Chart
You can add and style headings and footings in a chart.
- On the WebFOCUS Home Page, click the Designer tab.
- Click Chart.
- Choose a data source and click Select.
- Add one or more measures and dimensions.
-
On the Quick Access Toolbar, click Show option and select Footing, as shown in the following image.

The headers and footers display, as shown in the following image.

- Double-click the heading and change it to Gross Profit by Category.
The access options to edit the header and footer text are shown in the following image.

-
Change the font color to grey and change the font size to 20, as shown in the following image.

- Change the footer to read October, 2018.
-
Change the font size to 8 and right-justify it, as shown in the following image.

Using headers and footers, you can add the finishing touches on your charts, identifying them with useful information for your audience. For example, when sharing and distributing your charts, headers and footers can help identify and streamline your communication.
- Release: 8206
- Category: Creating Content
- Product: WebFOCUS Designer
- Tags: How-to's