WebFOCUS Designer


104S8207: WebFOCUS Designer Series: Assembling Pages and Building Portal Applications (eLearning)

In this course, you will learn the basics of building portal applications with WebFOCUS Designer to support the key capabilities that enable you to maximize the power of your data as you create insights, analyses, reports, and visualizations.

103S8207: WebFOCUS Designer Series: Creating Visualizations (eLearning)

In this course, you will learn the basics of creating content with WebFOCUS Designer to support the key capabilities that enable you to maximize the power of your data as you create insights, analyses, reports, and visualizations.

This course offers a comprehensive study of creating content with WebFOCUS Designer and an interactive learning experience—six modular learning units, over 30 lessons, quizzes, a course technical challenge and an integrated AWS Cloud-enabled lab environment—collectively designed to build your proficiency as you move from unit to unit:

102S8207: WebFOCUS Designer Series: Using the WebFOCUS Home Page (eLearning)

In this course, you will learn how to navigate, configure, and customize the WebFOCUS 8207 Home Page to support the key capabilities that enable you to maximize the power of your data as you create insights, analyses, reports, and visualizations.

This course offers a comprehensive study of the WebFOCUS Home Page and an interactive learning experience—two modular learning units, over 15 lessons, quizzes, two unit challenges and an integrated AWS Cloud-enabled lab environment—collectively designed to build your proficiency as you move from unit to unit:

101S8207: WebFOCUS Designer Series: Getting Started (eLearning)

In this introductory course, you will learn how to navigate WebFOCUS Designer and begin working with the key capabilities that enable you to maximize the power of your data as you create insights, analyses, reports, and visualizations.

This course offers a comprehensive introduction to WebFOCUS Designer and an interactive learning experience – six modular learning units, over 25 lessons, quizzes, three unit challenges,  a course technical challenge, and an integrated AWS Cloud-enabled lab environment— collectively designed to build your proficiency as you move from unit to unit:

Providing Access to Content Items and WebFOCUS Tools

When assembling pages from existing content in WebFOCUS Designer, two preset containers are available that allow you to provide access to content saved to your Repository. These are the Workbench template and the Explorer widget. In addition to running content, the Explorer widget allows users to create new content using the same options that are available on the WebFOCUS Home Page.

Working With Content Containers

When you add content to a page, it is automatically placed in a container. To move and resize the content item, move and resize the container into which it was placed by dragging the container or its resizing handles. You can also configure and style a container by selecting it on the page and then using the options on the Settings and Format tabs of the Properties panel. Note that the options for a container are separate from those for the content item inside the container. To select the container, click the container toolbar, or select a container from the Outline tab of the sidebar.

Formatting Box Plots

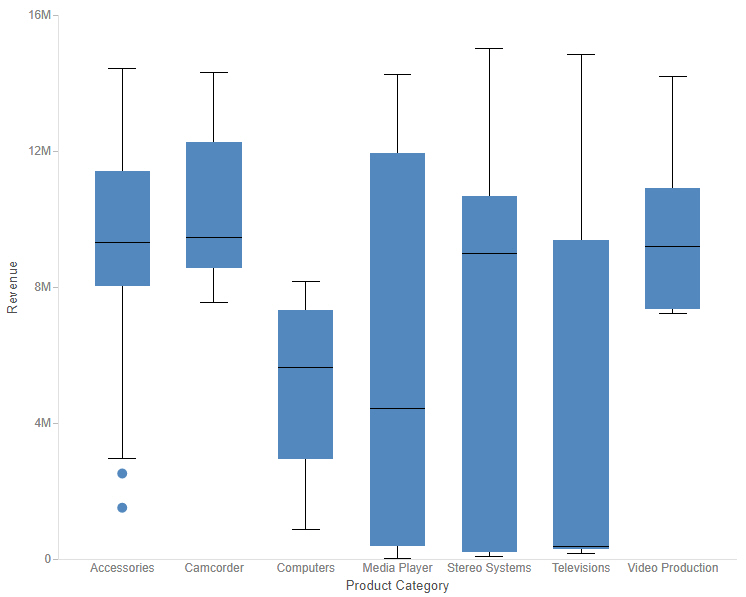
A box plot is a common chart type used to show key distribution information for a set of data points. A box plot displays outliers, the median, the upper and lower quartile, and the maximum and minimum with outliers excluded, by default. However, you can use the Box Plot options on the Format tab to show the mean, or average, as well. Additionally, you can change the display of the whiskers from lines to boxes, and change the style of the median and whisker lines.

Creating Statistical Box Plot Charts

A box plot, also known as a box-and-whisker plot, is a chart type that provides distribution information about your data. The box represents the range between the upper and lower quartiles, and the line inside the box represents the median. The whiskers represent the maximum and minimum with outliers excluded, and outliers are represented by individual points. An example of a box plot is shown in the following image.


boxplot

Exporting a Page as a PDF or Image

You can instantly download a snapshot of your page as a PDF document or .png image using the Export to file menu on the page toolbar. This allows you and anyone running the page to quickly capture its current state, with filter selections applied, in a format that can be easily reused, distributed, added to PowerPoint presentations, and more.