How-to's


Creating Mekko Charts

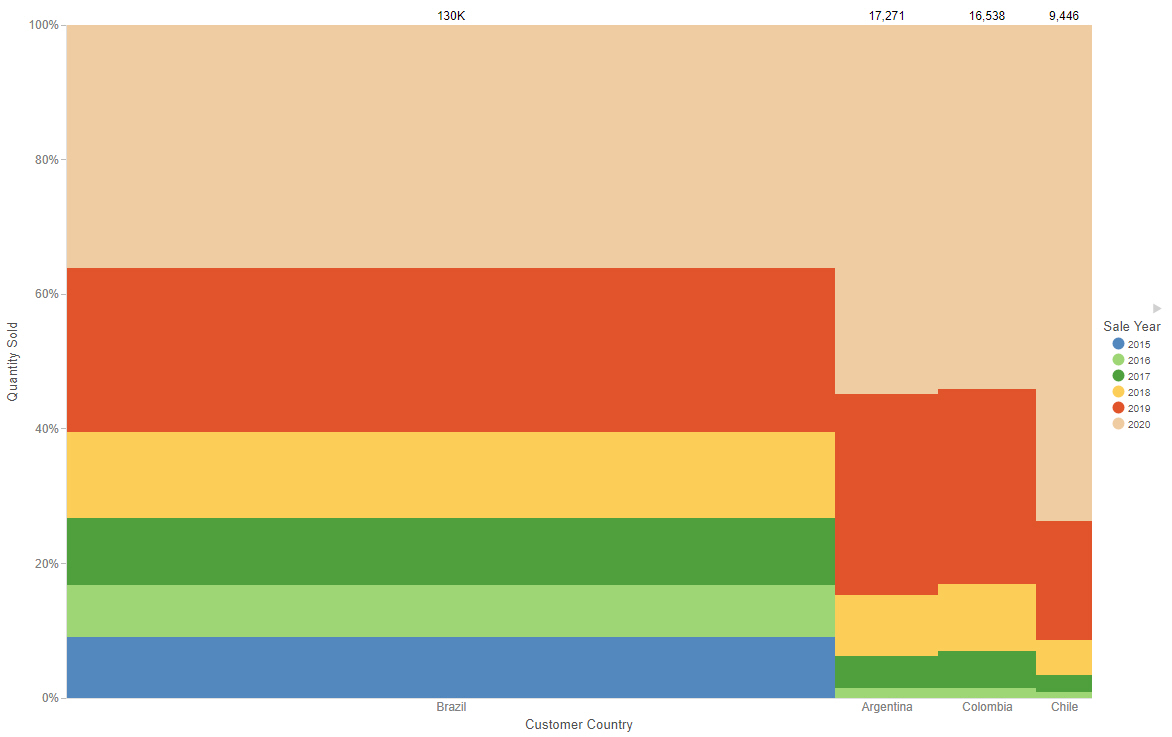
A Mekko chart allows you to see proportional values of a measure field for two dimension fields. The intersections of these dimension fields and their relative sizes make it possible to quickly identify the most significant combinations of values. An example of a Mekko chart is shown in the following image.


mekko chart

The following display options are available for a Mekko chart:

Creating Funnel Charts

A funnel chart shows values of a dimension field as a proportion of the whole, similar to a bar in a stacked bar chart. The shape of the funnel makes it useful to show information about processes that involve cascading or narrowing down due to the hierarchy it implies. For example, the following image shows revenue by year in a funnel chart. The entire funnel can be taken to represent all sales, with the top segment representing the most recent year, the top two segments the two most recent years, and so on.

Creating Gauge Charts

A gauge is a simple visual that shows a measure value. These can be used to create straightforward KPI graphics, or use matrix rows and columns to compare data for different sort values. The following example shows a gauge chart with matrix rows.


matrix gauge chart

The following display options are available for a gauge chart:

Creating Waterfall Charts

Waterfall charts allow you to see incremental positive and negative changes in your data, resulting in a rolling total. Positive and negative values are represented by different colored risers that start at the end point of the previous riser. Waterfall charts can be a good way to show change over time. An example of a waterfall chart is shown in the following image.


waterfall chart

The following display options are available for a waterfall chart:

Video: How to Pass Parameter Values to a Page Using Drill-Down Links

You can use parameterized drilldowns to connect to a page in your repository. Whereas in InfoAssist you must use a URL to drill to the page, when you create charts and reports in WebFOCUS Designer, you can simply select the page that you want to drill to using a file picker. The value that you click or select in your content can be passed to the page as a parameter. The page opens with your selections already applied as filter values, creating a seamless transition between content items. 

Video: How to Create Analytical Dashboards for Use on Mobile Devices

Adaptive Dashboard provides a mobile view with a fixed layout that will make the dashboard easier to use while navigating on mobile devices. You can use a number of filters, so keep these in mind, as we will discuss them in more detail a little bit later.

You can enable the Adaptive Dashboard option on new or existing In-Document Analytic documents in InfoAssist by clicking the Adaptive Dashboard button on the Layout tab of the ribbon, under the Page Setup group.

Adding Drill-Down Links to Content

Drilldowns are a powerful feature that allows users to navigate from one content item to another, providing access to additional, related information at run-time. Drill-down links can also be used to pass parameters, so that the target content is automatically filtered for the value that a user selects, allowing you to maintain context between items. By linking content with drilldowns, you can vastly expand the amount of information that is available from a single chart or report.

Video: How to Pass Parameter Values to a Page Using a URL Drilldown

You can pass parameter values from a chart or report to a target page using a URL drilldown. The value that you click or select is passed to the page as part of its run-time URL. The page opens with your selections already applied as filter values, creating a seamless transition between content items.

Video: How to Use Report Patterns

WebFOCUS Designer includes three common patterns that you can instantly apply by selecting one from the report picker. By using report patterns with different combinations of fields in the Row, Column, and Summary buckets, you can quickly transform a report into a number of common layouts.
First, let’s create a default, standard report, by adding Product Category and Sale Quarter to the Rows bucket and Quantity Sold, Cost of Goods, and Revenue to the Summary bucket.

Passing Parameter Values to a Page

When a page includes content with dynamic parameter filters, you can pass parameter values to it from external content to set the filter values when the page initially loads. For example, you can create a chart or report with drill-down links that point to the page, and configure the drilldowns in such a way that the value the user clicks in the chart or report is used as a filter value in the page. This allows users to navigate between content items and determine the scope of the information that they want to see.