Overview of In-Document Analytics (8207)
Content that uses In-Document Analytics provides users with an interactive interface that allows the generation of real-time, dynamic reports, charts, and dashboards. Its versatility allows you to package a data set with a combination of analytical views, resulting in highly intuitive and interactive self-service business intelligence. This gives you an edge in presentation and analysis, making it easy to develop and share concepts, ideas, and scenarios. An interactive report is a self-contained report, meaning that it contains all the data and JavaScript® within the HTML output file. Packaging the data and the interactive functions in the HTML file also makes the output highly compressible for email and transparent to security systems. If you are working with a larger data set, you can also zip the output files to reduce the file size when sending them through email.
Your users can explore and interact with your data using various analytical tools such as sorting, filtering, calculations, roll-ups, and pivoting. They can also experiment with different scenarios using various options.
All of the interactive content that you create functions independently of a server, and is portable, making it easy for your users to work with and analyze complex data without requiring the use of an external application, such as Microsoft Excel. With two types of users (developer and end user), the roles in development and delivery of materials are clear. The end user interacts with the content that the developer creates and deploys. They can obtain content without any additional plug-ins or programs should they choose to access your content remotely or offline, independent of a server.
Note: Each artifact that you create at run time is given a unique number for easy identification. This number is incremental but not consecutive, and is assigned automatically.
In InfoAssist, you can enable In-Document Analytics functionality, by selecting the HTML Analytic Document format (formerly known as AHTML) on the Home tab. The HTML Analytic Document format, as it appears in InfoAssist, is shown in the following image.

There are also two available styles that you can apply from the Procedure Settings dialog box. If you created interactive content in an earlier release, you can continue to use this style, which is known as Legacy. Legacy provides options like the Chart/Rollup and Pivot tools. An example of legacy style in a report is shown in the following image.

Alternatively, you can use the Designer Style, which currently presents some of the same options, but displays more like a page that you create in WebFOCUS Designer. An example of Designer style in a chart, is shown in the following image.

When you run your content, you can review and continue to develop it using the available menus. For example, when you run a chart, you can select the chart menu to change the type of chart you are showing, as shown in the following image.

To add a new chart or edit your content, you can use the options available from the Options menu, which is shown in the following image.
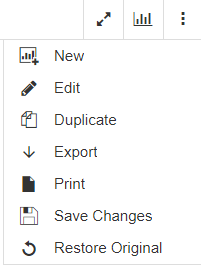
When you view your report or chart at full screen, a hamburger menu also displays, as shown in the following image. From this menu, you can exit full screen, save changes, or restore the dashboard.

Interactive content that you create in WebFOCUS, such as reports and charts, are saved as procedures. You can view the code that is stored in the procedure from within InfoAssist, or the Text Editor. When you view the code for interactive content, you will be able to see which style the procedure uses, with the ARVERSION setting. Interactive content using the Legacy Style is ARVERSION=1, while the Designer style is ARVERSION=2.
By default, all new content that you create in InfoAssist uses the Designer style, ARVERSION=2. If you edit an existing item that uses the Legacy style, that style will remain unless you change the ARVERSION to ARVERSION=2. This would reset the content to display in Designer style.
You can also password protect your interactive content to restrict users from viewing it unless they enter a password. Data is encrypted using the 256-bit Advanced Encryption Standard (AES) specification, and the password is used as the key for decrypting and encrypting the data. Therefore, the password is not stored in the interactive content, and you do not need a connection to go back to the server for password verification.
The HTML page, enabled with In-Document Analytic capabilities, contains both the JavaScript and the data for the content so you can interact with the data in a disconnected mode. Internet Explorer detects the JavaScript and issues a warning. If you look at the Internet Explorer warning, it mentions explicitly the detection of interactive content, which is the JavaScript. The same warning appears when pop-ups are blocked in the browser.
Because all post-retrieval processing is performed in the memory of the web browser, interactive content that has In-Document Analytics enabled, has a processing limit of approximately 5,000 records or 100 pages of output. Using the cache option, you can send only the first page of content output to the browser and retrieve subsequent pages from a temporary cache on the Reporting Server. The server also becomes the resource for performing all calculations, sorting, and filtering when caching is enabled. Since caching uses on-demand paging functionality, WebFOCUS Viewer is not supported.
Content with the cache option in the clustered server environment, using Cluster Manager (CLM), will maintain the connection with the WebFOCUS Reporting Server on which the temporary cache is created. This enables the retrieval of subsequent pages from the browser, while it is in the same browser session.
Note: When working in CACHE OFF mode, in AHTML (or In-Document Analytics) format, you can export output to CSV (comma-separated values) format at run time. The file is automatically sent to the Downloads folder, and applies to all browsers.
The caching feature uses a POST instead of a GET in an HTTP request.
You can save interactive content from your web browser to another location, such as your repository or an FTP server. You can also send interactive content by email or by using a distribution list. This sends the interactive report, chart, or dashboard as an email attachment, distributing it to one or more people through email, as an HTML attachment. If you are sending an interactive dashboard that contains one or more reports or charts, you can burst the distribution by defining parameters in ReportCaster, which sends relevant sections of the dashboard and saves each section as a separate file. Whichever way you choose to send your interactive content, you must keep in mind how it will be viewed.
For example, when you send a report as an HTML attachment to email, many client email programs on a mobile device can block the JavaScript in the attachment. A third-party tool, such as the WebFOCUS Mobile app for a mobile device, may be used to correctly view the attachment.
When you create interactive documents that contain more than one report or chart, you can also share the document by setting up a burst distribution by defining parameters in ReportCaster. This functionality distributes relevant sections of the dashboard to individual users you specify, and saves each section to a separate file.
If you try to view an interactive report in a web browser, and JavaScript is blocked or disabled on your web browser, you will receive a message reminding you that JavaScript must be enabled on the browser. If you are using a mobile device, the message directs you to use the WebFOCUS Mobile app. If the app is not installed, you can download it from the App Store® for iOS devices or from the Google Play™ store for Android™ devices. In the message, App Store and Google Play store are hyperlinks to the WebFOCUS Mobile app.
The message is displayed on the Desktop or on a supported mobile device when JavaScript is disabled in a web browser used to open an online or offline report. It is also displayed on the Preview pane or window of an application used to preview the content of an offline report.
The following image shows JavaScript disabled in Google Chrome™.

- Release: 8207
- Category: Visualization and Analytics
- Product: In-Document Analytics
- Tags: Enhancements, Release Features