Changing Content Types
You can use the Content picker, on the right-side of the Designer interface, to change chart and report types in your visualization.
When a chart or report is selected, the Content picker allows you to select a chart type or report layout. This includes the ability to change your content from a chart to a report in addition to changing to different varieties of each content type.
By default, the Content picker is collapsed, allowing you to scroll through common options, as shown in the following image.
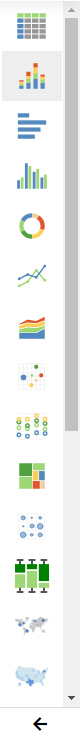
You can click the arrow at the bottom of the Content picker to expand it to display all content options, including additional report layouts, different map types, additional chart types, and chart extensions that you have enabled in your environment. The expanded Content picker is shown in the following image.

When you change the chart or report type, fields may need to be rearranged in, and in some cases removed from, their buckets to accommodate the new type. You can rearrange them as needed.
- Release: 8207
- Category: Visualizing Data
- Product: WebFOCUS Designer