Using the WebFOCUS Designer Canvas
The canvas displays the current state of your content as you create it. You can select items in the canvas to edit them, drag resources such as fields or containers onto the canvas to add them to your content or page, and use on-chart filtering to create filters based on visual selections.
The canvas also contains, if enabled from the Properties panel, heading text for each component, as well as optional footers for charts and reports. You can double-click this text to edit it, and then type new text, make styling changes to header and footer text using the text toolbar that appears, and even drag a field into the header to create dynamic header text that displays the first available value for the field at run time.
Initially, if you choose to create a visualization with new content, the canvas allows you to create and edit a single chart or report.
The chart or report fills the entire canvas. Some options are only available when creating a single content item. For example, you can only enable Auto Drill or Auto Linking for stand-alone content items and only make a stand-alone item an Auto Linking target.
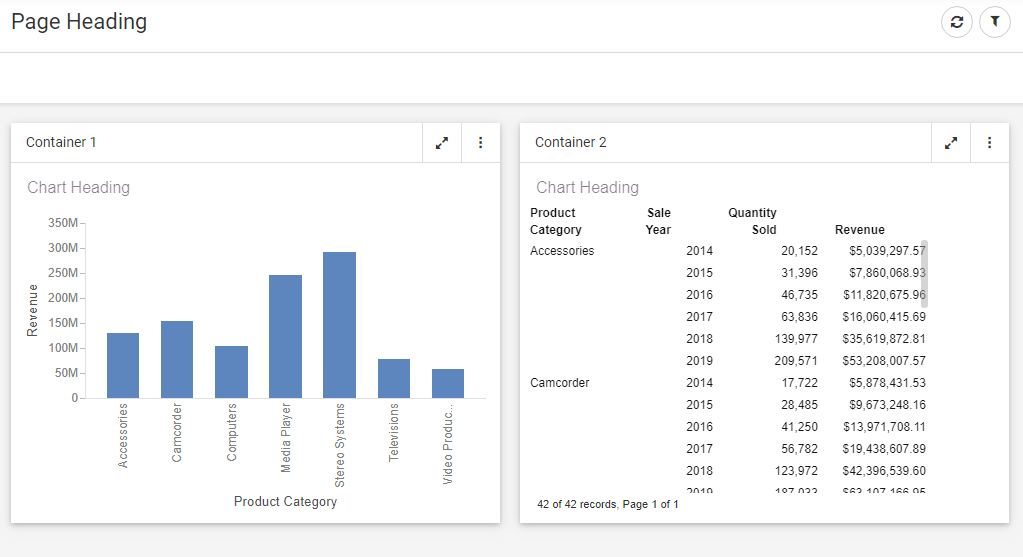
When you click the Add visualization button, the initial content item is moved into a container, and the visualization consists of two containers on a page. You can now select the page, a page section, a container, or a content item to display options pertinent to each in the Properties panel. If you hold the Ctrl key, you can select multiple containers, controls, or sections to apply the same changes to each. The canvas with two containers is shown in the following image.
To transform a single item into a page without adding a second container, click the Page.
Once you have added a second item to the page, allowing you to access container options, you can drag a container onto the page from the Resources panel when the Container tab is selected on the sidebar. Click and drag a container from the Resources panel, and drop it in the desired location.
Once a container is placed on the page, you can click and drag the container toolbar to move it. A blue highlighted area shows where the container will be dropped. If necessary, other containers on the page will move to accommodate the placement of the container that you have moved.
If you point to a container, a set of sizing handles appears. If you click and drag one of these handles, you can resize a container on the page. The contents of the container automatically resize to fit the new container dimensions.
The same types of components are available in a page assembled from existing content. These pages are created by clicking the plus button on the WebFOCUS start page or WebFOCUS Home Page and clicking Assemble Visualizations. When assembling content into a visualization, you cannot edit individual, external content items. However, additional options are available for certain components. For example, you can change styling and default values for filter controls, style and rearrange the filter grid, and unlock a container for run-time customization. When assembling a page from existing content, if you hold the Ctrl key, you can select multiple containers, controls, or sections to apply the same changes to each.
You can click and drag to select an area of a new chart created in a visualization to filter it. When you make a selection, a tooltip appears, giving you the option to filter for the values in the selected areas of the chart, or filter the visualization to exclude those values. A filter control is added to the Filter toolbar, and all content created in the visualization is affected, allowing you to filter your content quickly and intuitively. To clear the filter, remove the filter control from the toolbar. The filter is removed from all affected content.
The canvas shows a design view of your content. To see a full run-time view of your visualization, with run-time functionality such as drilldowns, In-Document Analytics, and more, click Run in new window on the Visualization toolbar. Your content runs in a new browser tab or window.
Clicking Preview opens a preview of the visualization in the same browser tab in which you are designing your content. To return to the canvas, point to the blue button that is docked at the top of the screen to make it visible, then click it.
- Release: 8207
- Category: Visualizing Data, Adding Content to Pages
- Product: WebFOCUS Designer